> ## Documentation Index
> Fetch the complete documentation index at: https://docs.notifuse.com/llms.txt
> Use this file to discover all available pages before exploring further.
# Analytics Assistant
> Ask questions about your traffic, get a written summary of a period, and let the assistant drive the dashboard.
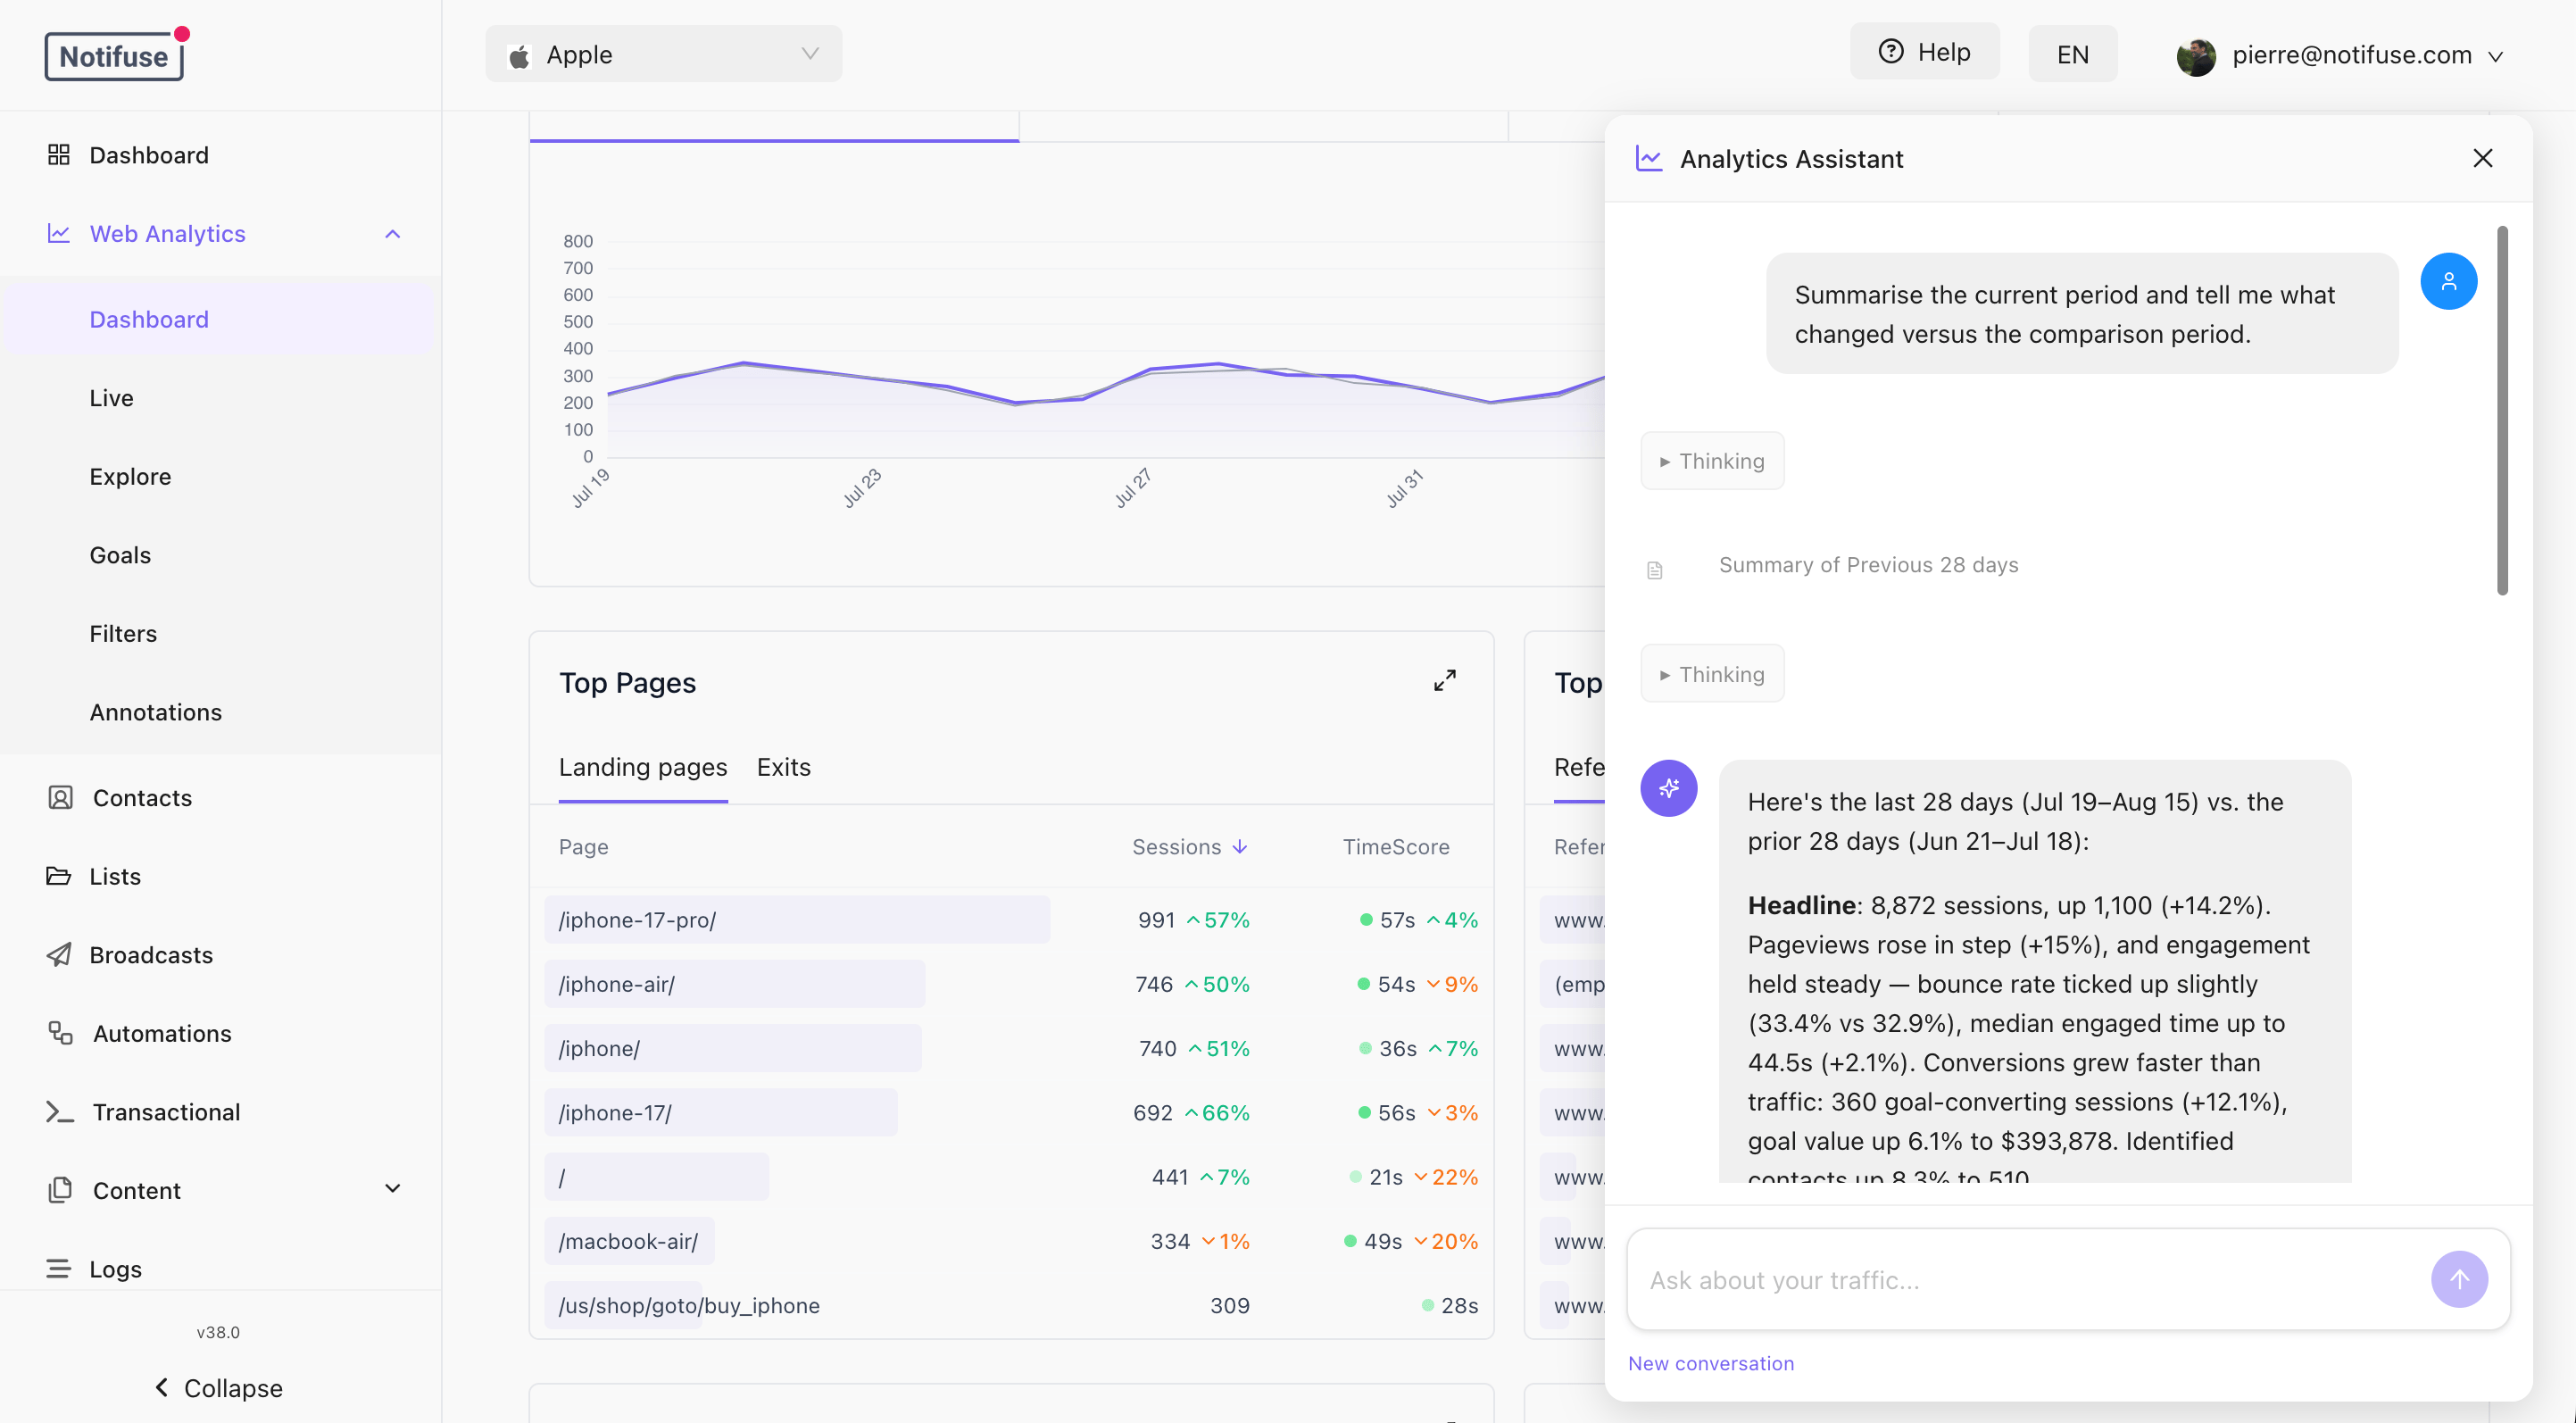 The Web Analytics section has an AI assistant. It answers questions about your own traffic, writes a summary of the period you are looking at, and can change what is on screen for you.
It reads your reports through the same queries the dashboard itself runs, so an answer it gives and the chart beside it cannot disagree.
This is the Web Analytics surface of the workspace [AI Assistant](/features/ai-assistant), which runs on your own provider key. Until an LLM integration is configured, the panel offers a link to set one up instead of a chat box.
## Opening it
Once Web Analytics is enabled, a button sits in the bottom-right corner of the Dashboard, Explore and Goals sections. It is not available on the Filters section, which configures attribution rules rather than reading a report.
An empty conversation offers a few starters — summarise the period, explain a change, top sources, best and worst pages. Clicking one sends it.
## What it can answer
Anything the reports can express:
| Question | What it does |
| --------------------------------------------------------- | --------------------------------------------------------------------------------------------------------- |
| "How many sessions last week, and how does that compare?" | Runs the totals for both windows and reports the change |
| "Which campaigns drove the most conversions this month?" | Groups goals by UTM campaign |
| "What are my worst landing pages by bounce rate?" | Breaks sessions down by landing page, sorted the way you asked |
| "Show me traffic by hour of day" | A bucketed series over the period |
| "Summarise this period" | Pulls headline metrics, the trend and the leading breakdowns in one pass, then writes what actually moved |
Ask it something the data cannot answer and it will say so rather than guess. It is instructed not to claim a cause it cannot see in the numbers — a drop that lines up with one campaign ending is reported as exactly that, not as a conclusion.
## Driving the dashboard
The assistant can change the screen as well as read it:
* set the period, a custom date range, the comparison window or the timezone
* apply, add to, or clear the dashboard filters
* open an Explore report grouped by the dimensions you asked for
* move between the Dashboard, Explore and Goals sections
"Show me last 30 days for organic search only" changes the period and the filter, and the whole dashboard follows. Changes it makes are ordinary dashboard state — undo them the same way you would your own.
## What it will not do
| Boundary | Why |
| ---------------------------------------------------------- | --------------------------------------------------------------------------------------------------------------------------------------------------------------------------------------------------------------------- |
| It never groups, sorts or filters by visitor email address | Asking for a report broken down by contact would send a list of identified visitors' addresses to your AI provider. The aggregate question still works: the **contacts** measure counts distinct identified visitors. |
| It does not report per-session coordinates | Latitude and longitude identify individuals. Country, region and city stay available. |
| It cannot create goals, saved filters or segments | It reports and navigates; it does not change your configuration. |
| It does not invent numbers | Every figure it states comes from a query it ran in that conversation. |
If the dashboard is already filtered to a single person when you ask a question, the assistant is told a filter is in force — otherwise it would misread every number — but not what the filter's value is.
## Data freshness
Sessions are written in batches, so the last minute or so of activity may not be in an answer yet, and a period that includes today includes an incomplete day. The assistant says so when it matters. For what is happening right now, use the live view instead.
## Model choice and cost
Answering here depends on tool calling: the assistant picks a query, reads the rows that come back, and reasons over them. If answers are vague, or it repeatedly says it cannot find a dimension, try a stronger model before assuming the data is at fault.
A data question also costs more than a plain chat of the same length. It takes at least two requests to the provider — one to choose the query, one to read the result — and a period summary is a large single result to read.
Provider options, model selection and how the panel reports cost are on the [AI Assistant](/features/ai-assistant) page.
## Related
* [AI Assistant](/features/ai-assistant) — setting it up, providers, and the email and blog surfaces
* [Reports](/web-analytics/reports) — the dimensions and measures the assistant queries
* [Goals](/web-analytics/goals) — how conversions get their type and value
* [Identifying visitors](/web-analytics/identifying-visitors) — what makes the `contacts` measure non-zero
The Web Analytics section has an AI assistant. It answers questions about your own traffic, writes a summary of the period you are looking at, and can change what is on screen for you.
It reads your reports through the same queries the dashboard itself runs, so an answer it gives and the chart beside it cannot disagree.
This is the Web Analytics surface of the workspace [AI Assistant](/features/ai-assistant), which runs on your own provider key. Until an LLM integration is configured, the panel offers a link to set one up instead of a chat box.
## Opening it
Once Web Analytics is enabled, a button sits in the bottom-right corner of the Dashboard, Explore and Goals sections. It is not available on the Filters section, which configures attribution rules rather than reading a report.
An empty conversation offers a few starters — summarise the period, explain a change, top sources, best and worst pages. Clicking one sends it.
## What it can answer
Anything the reports can express:
| Question | What it does |
| --------------------------------------------------------- | --------------------------------------------------------------------------------------------------------- |
| "How many sessions last week, and how does that compare?" | Runs the totals for both windows and reports the change |
| "Which campaigns drove the most conversions this month?" | Groups goals by UTM campaign |
| "What are my worst landing pages by bounce rate?" | Breaks sessions down by landing page, sorted the way you asked |
| "Show me traffic by hour of day" | A bucketed series over the period |
| "Summarise this period" | Pulls headline metrics, the trend and the leading breakdowns in one pass, then writes what actually moved |
Ask it something the data cannot answer and it will say so rather than guess. It is instructed not to claim a cause it cannot see in the numbers — a drop that lines up with one campaign ending is reported as exactly that, not as a conclusion.
## Driving the dashboard
The assistant can change the screen as well as read it:
* set the period, a custom date range, the comparison window or the timezone
* apply, add to, or clear the dashboard filters
* open an Explore report grouped by the dimensions you asked for
* move between the Dashboard, Explore and Goals sections
"Show me last 30 days for organic search only" changes the period and the filter, and the whole dashboard follows. Changes it makes are ordinary dashboard state — undo them the same way you would your own.
## What it will not do
| Boundary | Why |
| ---------------------------------------------------------- | --------------------------------------------------------------------------------------------------------------------------------------------------------------------------------------------------------------------- |
| It never groups, sorts or filters by visitor email address | Asking for a report broken down by contact would send a list of identified visitors' addresses to your AI provider. The aggregate question still works: the **contacts** measure counts distinct identified visitors. |
| It does not report per-session coordinates | Latitude and longitude identify individuals. Country, region and city stay available. |
| It cannot create goals, saved filters or segments | It reports and navigates; it does not change your configuration. |
| It does not invent numbers | Every figure it states comes from a query it ran in that conversation. |
If the dashboard is already filtered to a single person when you ask a question, the assistant is told a filter is in force — otherwise it would misread every number — but not what the filter's value is.
## Data freshness
Sessions are written in batches, so the last minute or so of activity may not be in an answer yet, and a period that includes today includes an incomplete day. The assistant says so when it matters. For what is happening right now, use the live view instead.
## Model choice and cost
Answering here depends on tool calling: the assistant picks a query, reads the rows that come back, and reasons over them. If answers are vague, or it repeatedly says it cannot find a dimension, try a stronger model before assuming the data is at fault.
A data question also costs more than a plain chat of the same length. It takes at least two requests to the provider — one to choose the query, one to read the result — and a period summary is a large single result to read.
Provider options, model selection and how the panel reports cost are on the [AI Assistant](/features/ai-assistant) page.
## Related
* [AI Assistant](/features/ai-assistant) — setting it up, providers, and the email and blog surfaces
* [Reports](/web-analytics/reports) — the dimensions and measures the assistant queries
* [Goals](/web-analytics/goals) — how conversions get their type and value
* [Identifying visitors](/web-analytics/identifying-visitors) — what makes the `contacts` measure non-zero