> ## Documentation Index
> Fetch the complete documentation index at: https://docs.notifuse.com/llms.txt
> Use this file to discover all available pages before exploring further.
# Reports
> Read the dashboard, explore any dimension, and watch traffic arrive live.
**Web Analytics** is a collapsible group in the sidebar with six entries: Dashboard, Live, Explore, Goals, Filters and Annotations. Everything except Live is also a tab on the Web Analytics page, so you can move between them without leaving it.
## What Gets Recorded
| Row | Written when |
| ------------ | --------------------------------------------------------------------- |
| **Session** | A visitor arrives. One row per visit, updated as they browse. |
| **Pageview** | Each page they open, with its engaged time and how far they scrolled. |
| **Goal** | Your site calls `trackGoal`. See [Goals](/web-analytics/goals). |
The tracker sends a beat every 7 to 30 seconds while someone is active — more often just after a page opens, tapering off — and each beat carries the whole visit so far. That means a report is never half-written: a session row always reflects everything known about that visit at the time it was last seen.
Beats stop after about ten minutes of accumulated active time on the same page. A tab left open for an hour is not counted as an hour of engagement; opening another page starts the cadence again.
## Dashboard
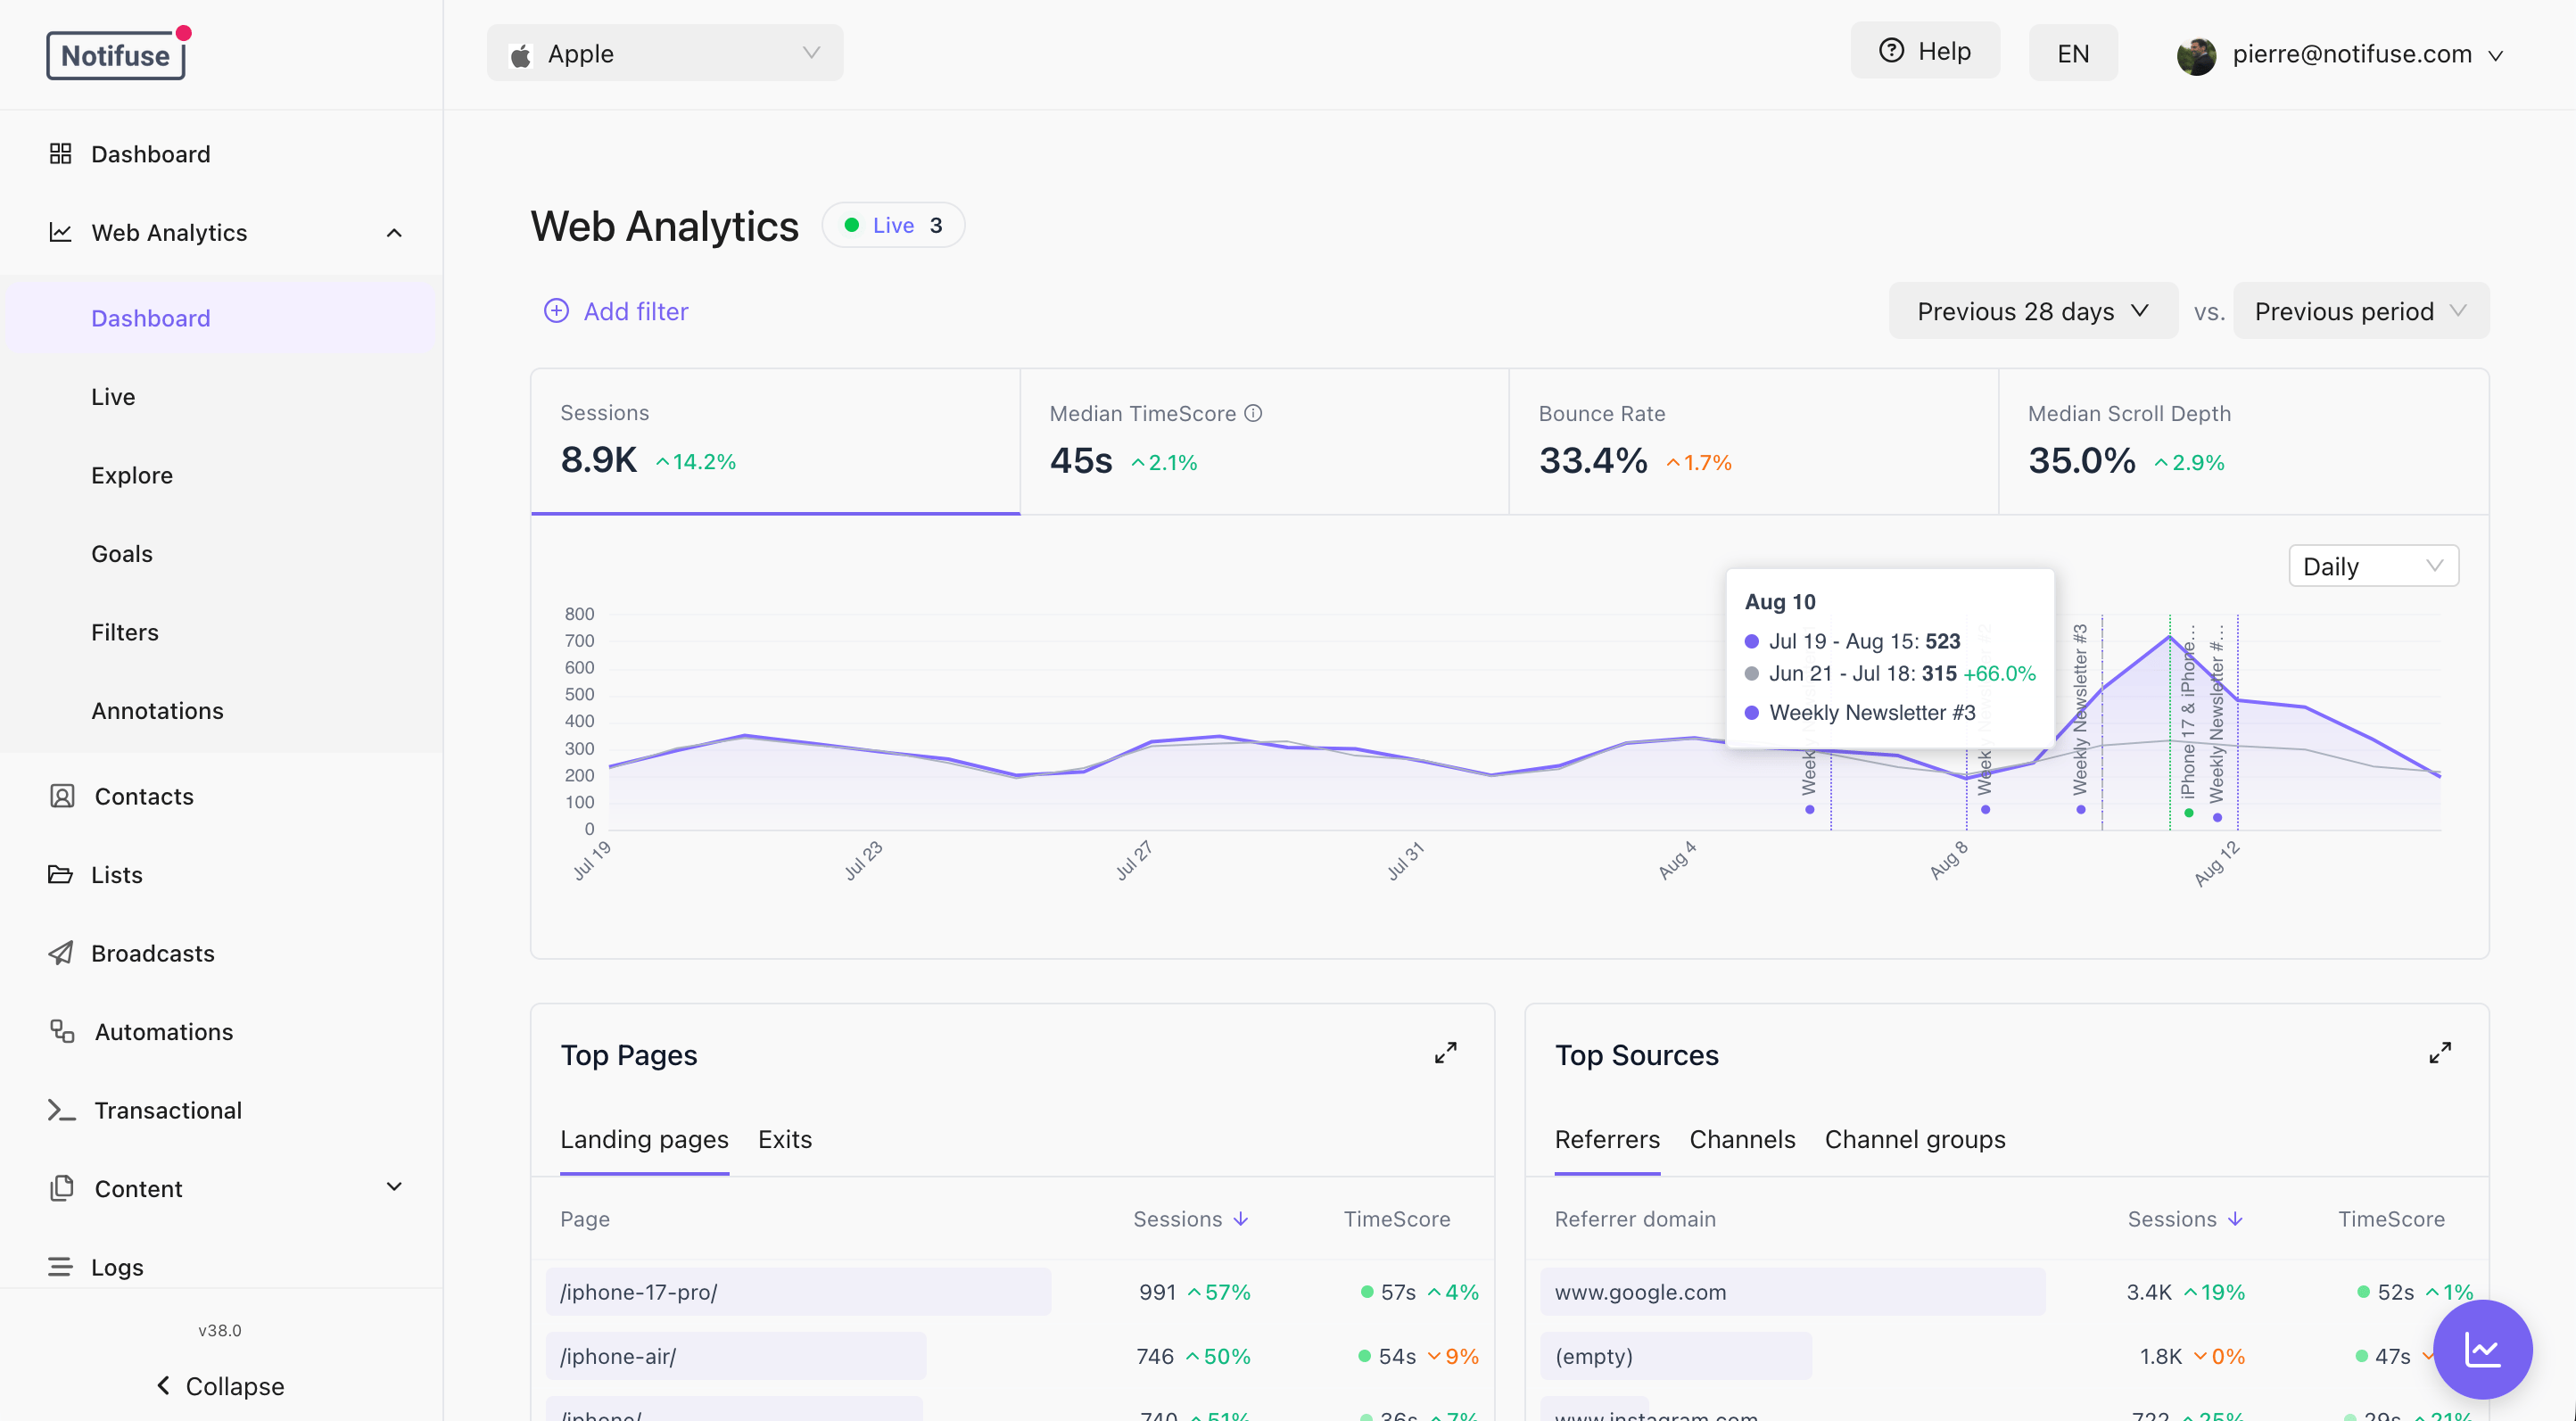 The headline numbers over the period you pick, with the breakdowns most people want first — sources, pages, countries, devices.
Clicking a row in any panel adds that value as a filter on the whole page, and clicking it again removes it. That is how the dashboard drills down: filters stack, so you can narrow to one country and one channel and watch every panel follow.
## Live
The headline numbers over the period you pick, with the breakdowns most people want first — sources, pages, countries, devices.
Clicking a row in any panel adds that value as a filter on the whole page, and clicking it again removes it. That is how the dashboard drills down: filters stack, so you can narrow to one country and one channel and watch every panel follow.
## Live
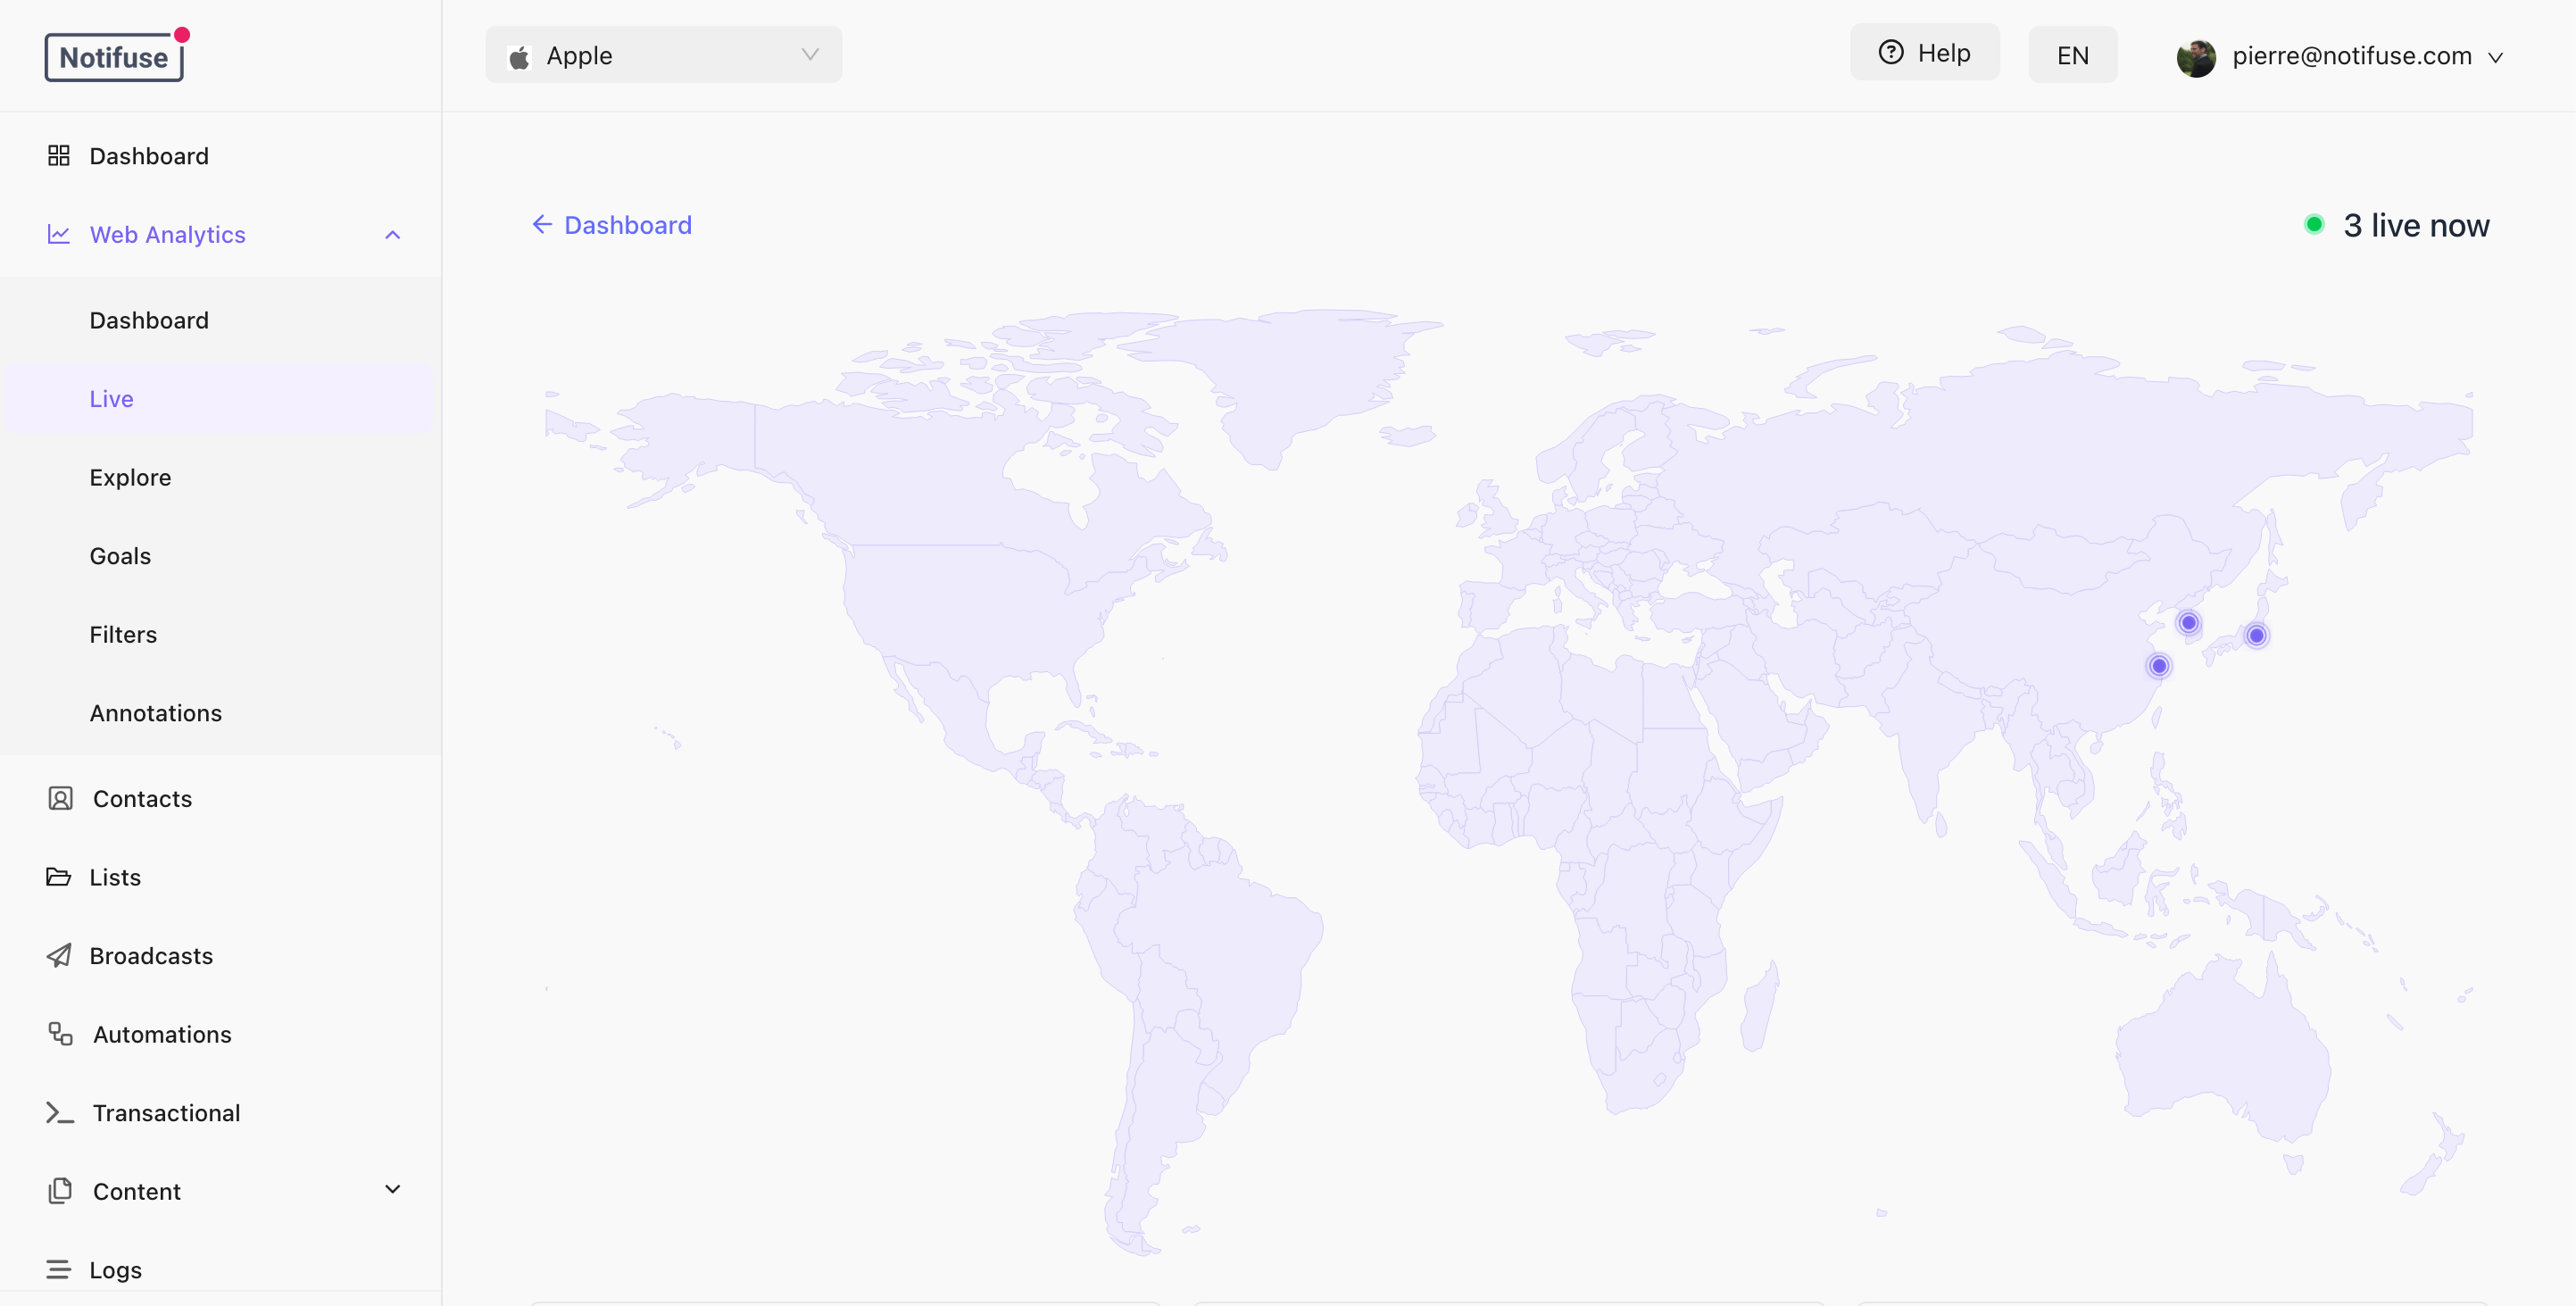 Everyone active in the last 30 minutes, refreshed every 10 seconds, with a map of where they are. The map plots up to 500 distinct locations, each marker carrying the number of sessions there.
## Explore
Everyone active in the last 30 minutes, refreshed every 10 seconds, with a map of where they are. The map plots up to 500 distinct locations, each marker carrying the number of sessions there.
## Explore
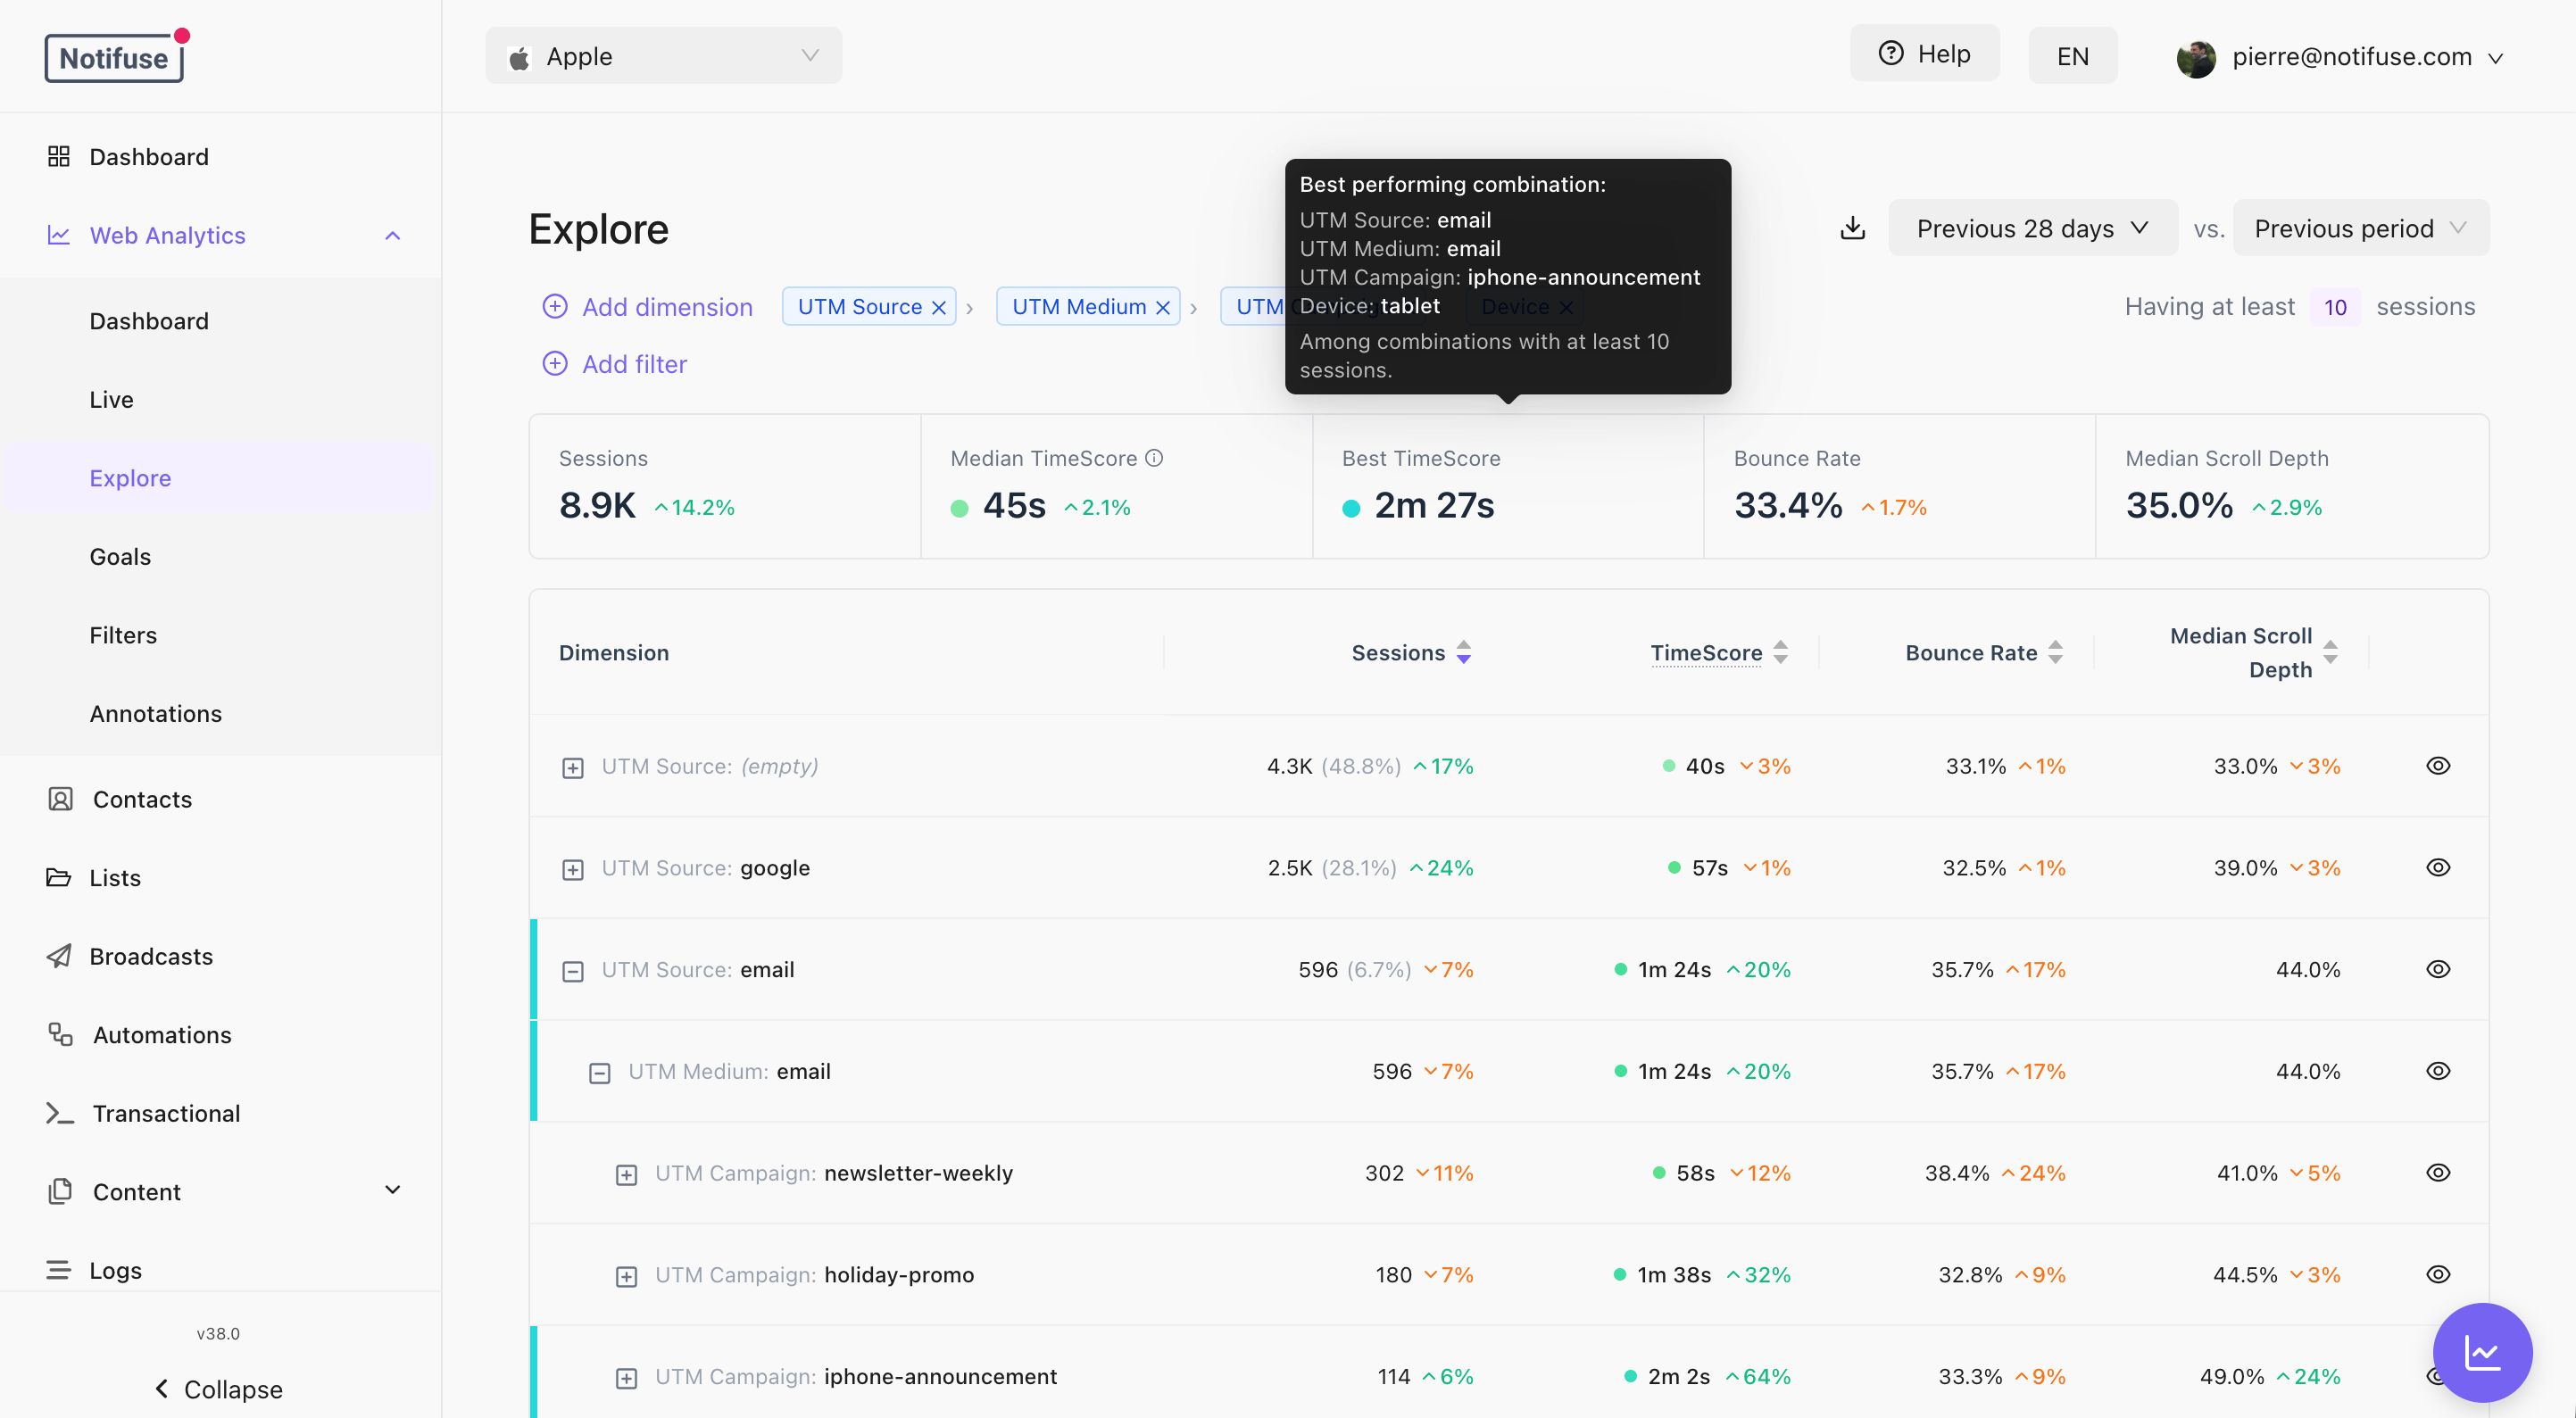 Break sessions down by any dimension, filter them, and export the result as CSV.
Explore reports on **sessions**, with four measures shown for every row:
| Measure | Meaning |
| ------------------- | ------------------------------------------- |
| Sessions | Number of visits |
| Median TimeScore | Median engaged time across those visits |
| Bounce Rate | Share of visits below your bounce threshold |
| Median Scroll Depth | How far down visitors got |
**Dimensions** are grouped as they appear in the picker:
* **Channel**: Channel, Channel Group
* **UTM**: Source, Medium, Campaign, Term, Content
* **Traffic**: Referrer, Referrer Domain, Referrer Path, Is Direct
* **Pages**: Landing Page, Landing Domain, Landing Path, Exit Path
* **Device**: Device, Browser, Browser Type, Operating System, Connection Type, screen and viewport size
* **Geo**: Country, Region, City, Language, Timezone
* **Time**: Hour of Day, Day of Week, Is Weekend, Year, Month, Day, Week Number
* **Session**: Pageview Count, Duration (ms), SDK Version
* **User**: Contact Email, once a visitor is identified
* **Custom**: `custom_1` through `custom_10`, under whatever names you gave them
Time dimensions here are cyclic, and are extracted in the report's timezone rather than UTC. "Traffic by hour of day" means the visitor's morning, not a number that shifts when your server moves. The session's own start and last-activity timestamps are what the date range filters on; they are not breakdowns.
Pageview-level dimensions — Page Path, Page Number, Is Landing Page, Is Exit Page, Entry Type — belong to the pageview schema, and Goal Name, Goal Path and Goal Value to the goal schema. Neither set is selectable in Explore; goal dimensions drive the [Goals](/web-analytics/goals) tab.
## Beyond the Screens
The three schemas define more than the screens display, and the analytics query API can reach all of it — the same endpoint the console calls, documented in the [API Reference](/api-reference).
* **Sessions** also define Pageviews, Pages / Session, Avg Scroll Depth, Median Page Duration, Sessions with Goals, Goal Value and Identified Contacts.
* **Pageviews** define Page Views, Unique Pages, Median Page Duration, Median Scroll Depth, Entries, Exits and Exit Rate, along with the page dimensions above. No Web Analytics screen queries them today.
* **Goals** define Goals, Total Goal Value, Avg Goal Value, Median Goal Value and Converting Sessions.
Median Page Duration means different things on the two schemas. On sessions it is the median across visits of each visit's own median page time; the true per-page median is the identically named measure on the pageview schema.
## Custom Dimensions
Ten slots let you record something only you know about a visit — a plan tier, a test variant, a logged-in role.
Set them from your site by slot number:
```javascript theme={null}
NotifuseAnalytics.setDimension(1, 'pro')
NotifuseAnalytics.setDimensions({ 1: 'pro', 2: 'variant-b' })
```
They can also arrive in the URL: a link carrying `?custom_1=pro` fills slot 1 whenever the tracker initialises on that page, which is useful for tagging traffic you send yourself without touching the page's code.
The URL only fills slots that are still empty for the session. A value already set by `setDimension` — or by an earlier URL in the same visit — wins. Values are read once at initialisation, so a client-side route change does not re-read them.
Then give the slot a display name under **Settings** → **Web Analytics** → **Custom dimension labels**. The name is what appears in the reports; the slot keeps its `custom_1` identity underneath, so renaming it never rewrites your data.
Custom dimensions can also be *derived* rather than sent — an [attribution rule](/web-analytics/attribution) can write one from the referrer, a UTM value or a landing path, which is how you classify traffic you did not tag at the source.
A [backfill](/web-analytics/attribution#changing-rules-later) leaves custom dimensions alone on rows its rules do not write, so values your tracker sent survive it. Only Channel and Channel Group are cleared, because nothing but a rule can set those.
## Notes
* Values are capped at 256 bytes per custom dimension. The tracker's own check counts characters, so non-ASCII values should stay well under 256 characters or the server will reject the beat.
* CSV exports respect the filters and period currently applied, up to 1,000 rows.
* [API Reference](/api-reference)
Break sessions down by any dimension, filter them, and export the result as CSV.
Explore reports on **sessions**, with four measures shown for every row:
| Measure | Meaning |
| ------------------- | ------------------------------------------- |
| Sessions | Number of visits |
| Median TimeScore | Median engaged time across those visits |
| Bounce Rate | Share of visits below your bounce threshold |
| Median Scroll Depth | How far down visitors got |
**Dimensions** are grouped as they appear in the picker:
* **Channel**: Channel, Channel Group
* **UTM**: Source, Medium, Campaign, Term, Content
* **Traffic**: Referrer, Referrer Domain, Referrer Path, Is Direct
* **Pages**: Landing Page, Landing Domain, Landing Path, Exit Path
* **Device**: Device, Browser, Browser Type, Operating System, Connection Type, screen and viewport size
* **Geo**: Country, Region, City, Language, Timezone
* **Time**: Hour of Day, Day of Week, Is Weekend, Year, Month, Day, Week Number
* **Session**: Pageview Count, Duration (ms), SDK Version
* **User**: Contact Email, once a visitor is identified
* **Custom**: `custom_1` through `custom_10`, under whatever names you gave them
Time dimensions here are cyclic, and are extracted in the report's timezone rather than UTC. "Traffic by hour of day" means the visitor's morning, not a number that shifts when your server moves. The session's own start and last-activity timestamps are what the date range filters on; they are not breakdowns.
Pageview-level dimensions — Page Path, Page Number, Is Landing Page, Is Exit Page, Entry Type — belong to the pageview schema, and Goal Name, Goal Path and Goal Value to the goal schema. Neither set is selectable in Explore; goal dimensions drive the [Goals](/web-analytics/goals) tab.
## Beyond the Screens
The three schemas define more than the screens display, and the analytics query API can reach all of it — the same endpoint the console calls, documented in the [API Reference](/api-reference).
* **Sessions** also define Pageviews, Pages / Session, Avg Scroll Depth, Median Page Duration, Sessions with Goals, Goal Value and Identified Contacts.
* **Pageviews** define Page Views, Unique Pages, Median Page Duration, Median Scroll Depth, Entries, Exits and Exit Rate, along with the page dimensions above. No Web Analytics screen queries them today.
* **Goals** define Goals, Total Goal Value, Avg Goal Value, Median Goal Value and Converting Sessions.
Median Page Duration means different things on the two schemas. On sessions it is the median across visits of each visit's own median page time; the true per-page median is the identically named measure on the pageview schema.
## Custom Dimensions
Ten slots let you record something only you know about a visit — a plan tier, a test variant, a logged-in role.
Set them from your site by slot number:
```javascript theme={null}
NotifuseAnalytics.setDimension(1, 'pro')
NotifuseAnalytics.setDimensions({ 1: 'pro', 2: 'variant-b' })
```
They can also arrive in the URL: a link carrying `?custom_1=pro` fills slot 1 whenever the tracker initialises on that page, which is useful for tagging traffic you send yourself without touching the page's code.
The URL only fills slots that are still empty for the session. A value already set by `setDimension` — or by an earlier URL in the same visit — wins. Values are read once at initialisation, so a client-side route change does not re-read them.
Then give the slot a display name under **Settings** → **Web Analytics** → **Custom dimension labels**. The name is what appears in the reports; the slot keeps its `custom_1` identity underneath, so renaming it never rewrites your data.
Custom dimensions can also be *derived* rather than sent — an [attribution rule](/web-analytics/attribution) can write one from the referrer, a UTM value or a landing path, which is how you classify traffic you did not tag at the source.
A [backfill](/web-analytics/attribution#changing-rules-later) leaves custom dimensions alone on rows its rules do not write, so values your tracker sent survive it. Only Channel and Channel Group are cleared, because nothing but a rule can set those.
## Notes
* Values are capped at 256 bytes per custom dimension. The tracker's own check counts characters, so non-ASCII values should stay well under 256 characters or the server will reject the beat.
* CSV exports respect the filters and period currently applied, up to 1,000 rows.
* [API Reference](/api-reference)