
What Gets Recorded
The tracker sends a beat every 7 to 30 seconds while someone is active — more often just after a page opens, tapering off — and each beat carries the whole visit so far. That means a report is never half-written: a session row always reflects everything known about that visit at the time it was last seen.
Beats stop after about ten minutes of accumulated active time on the same page. A tab left open for an hour is not counted as an hour of engagement; opening another page starts the cadence again.
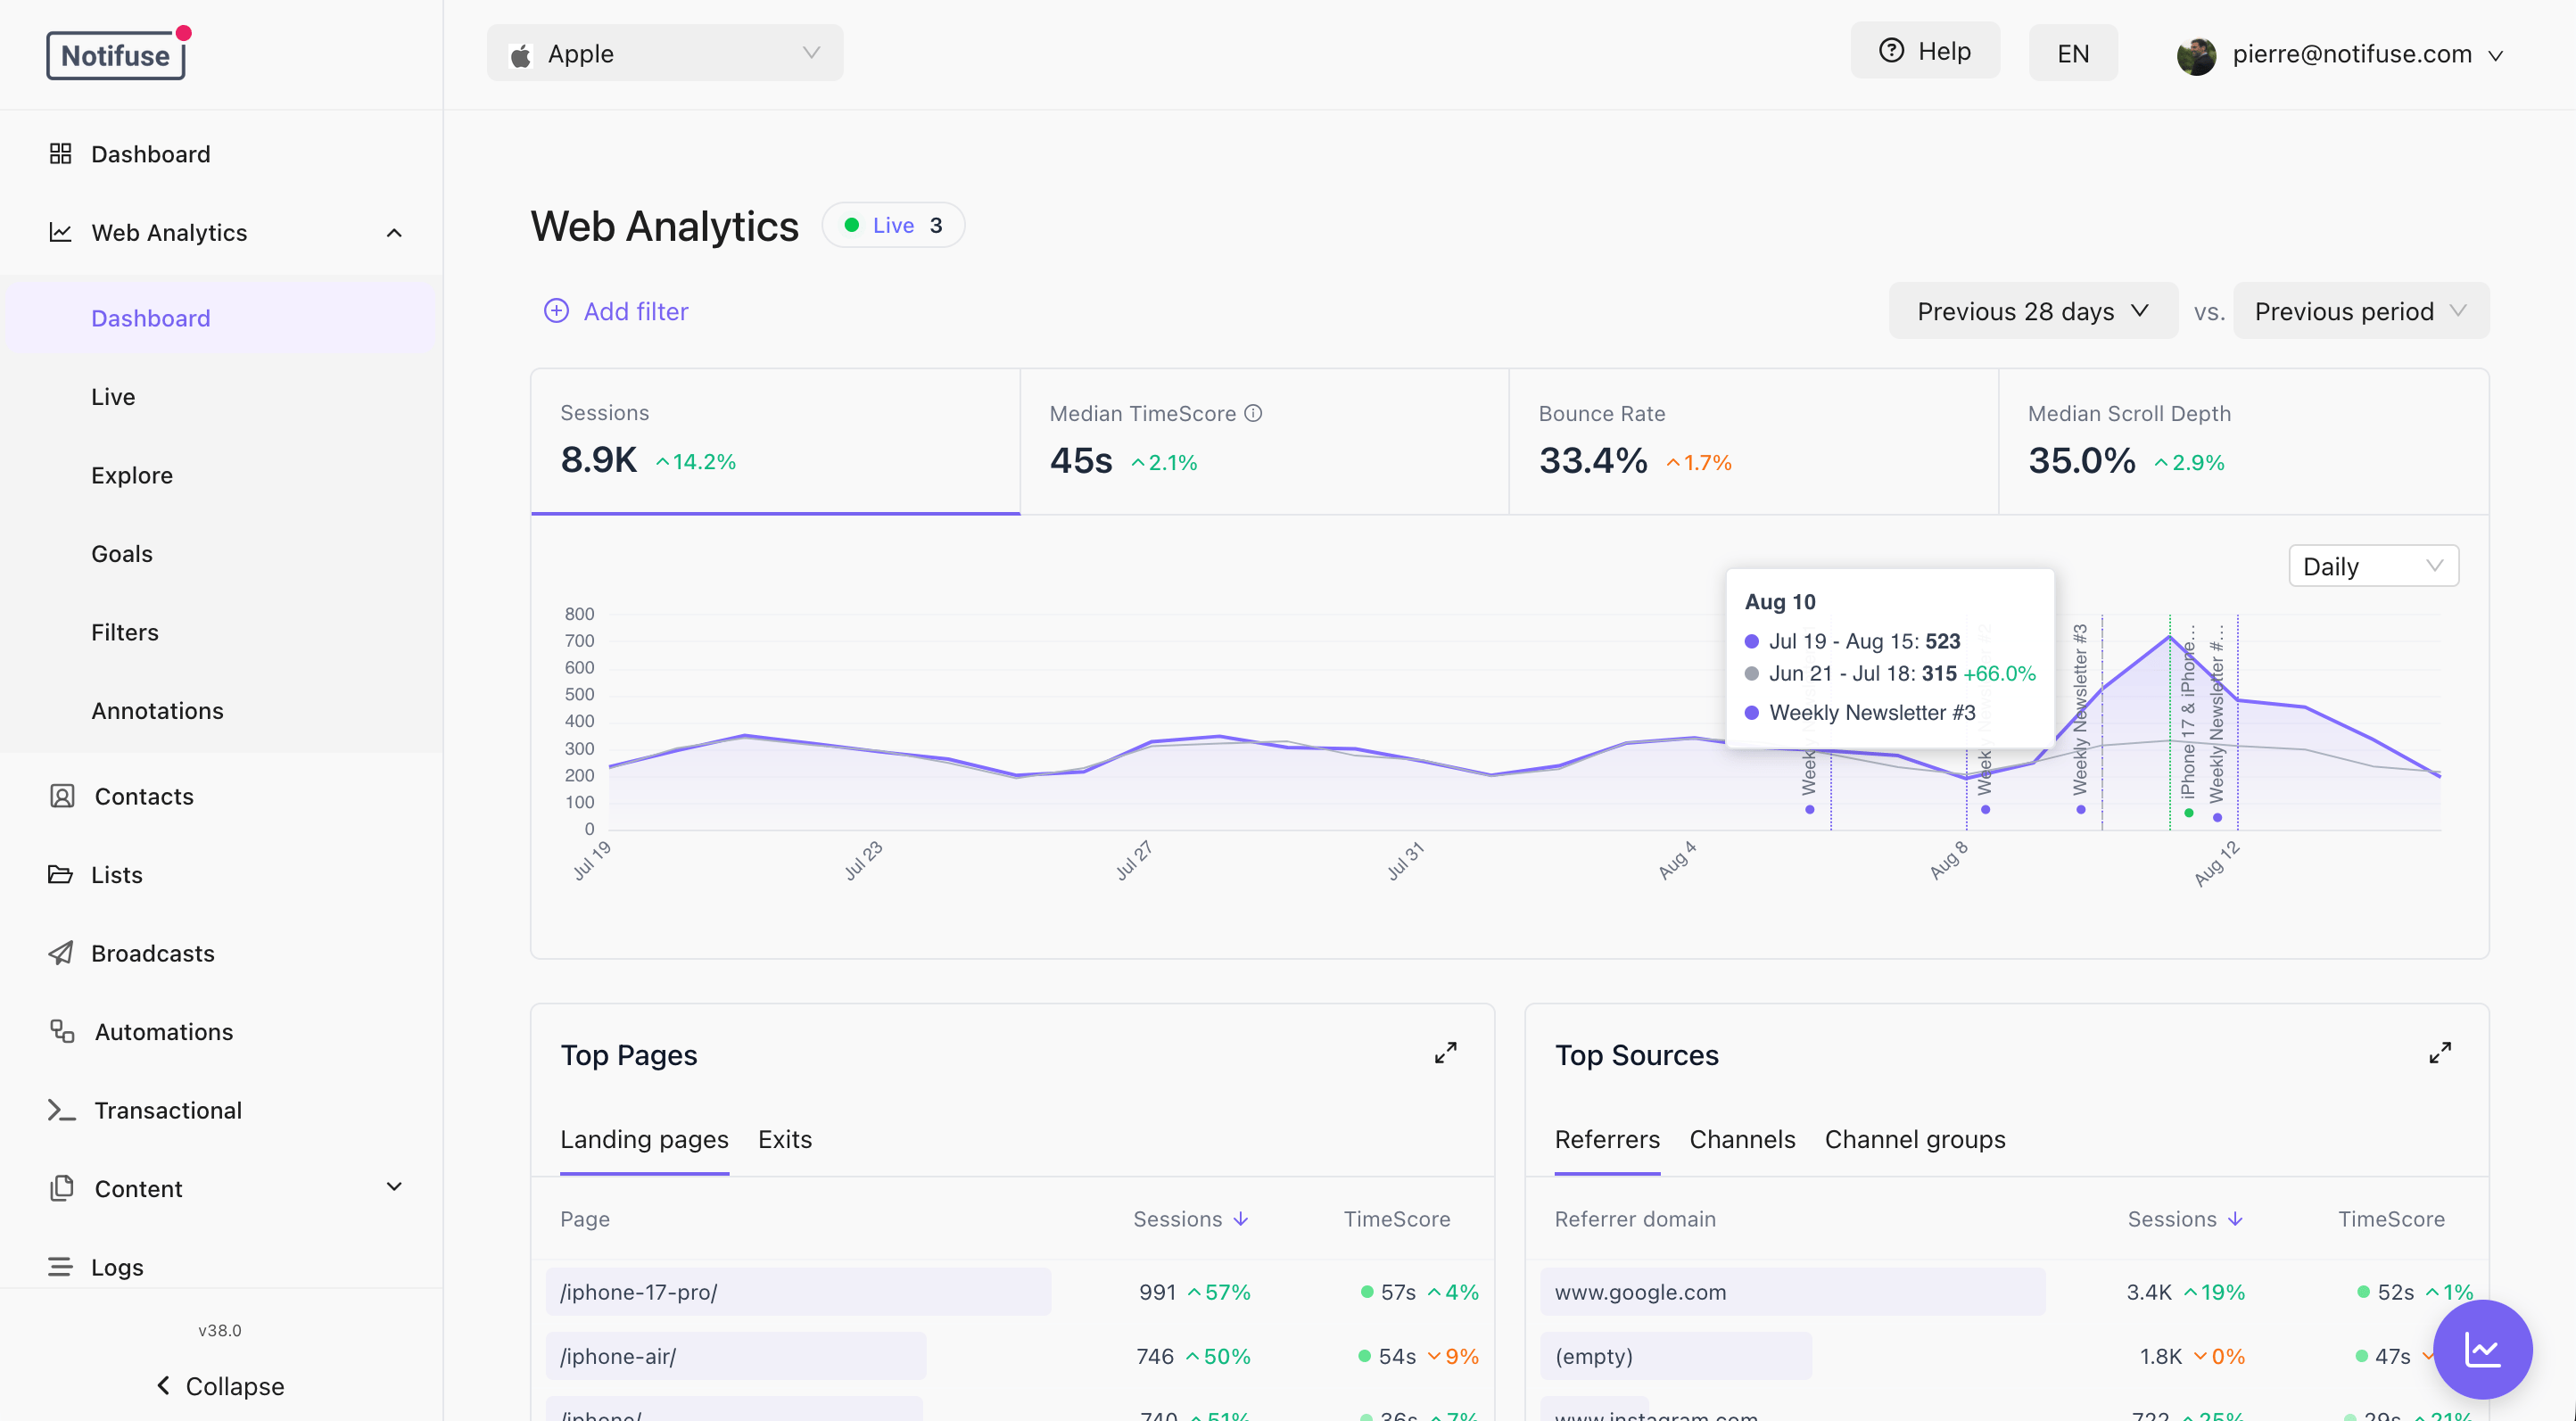
Dashboard
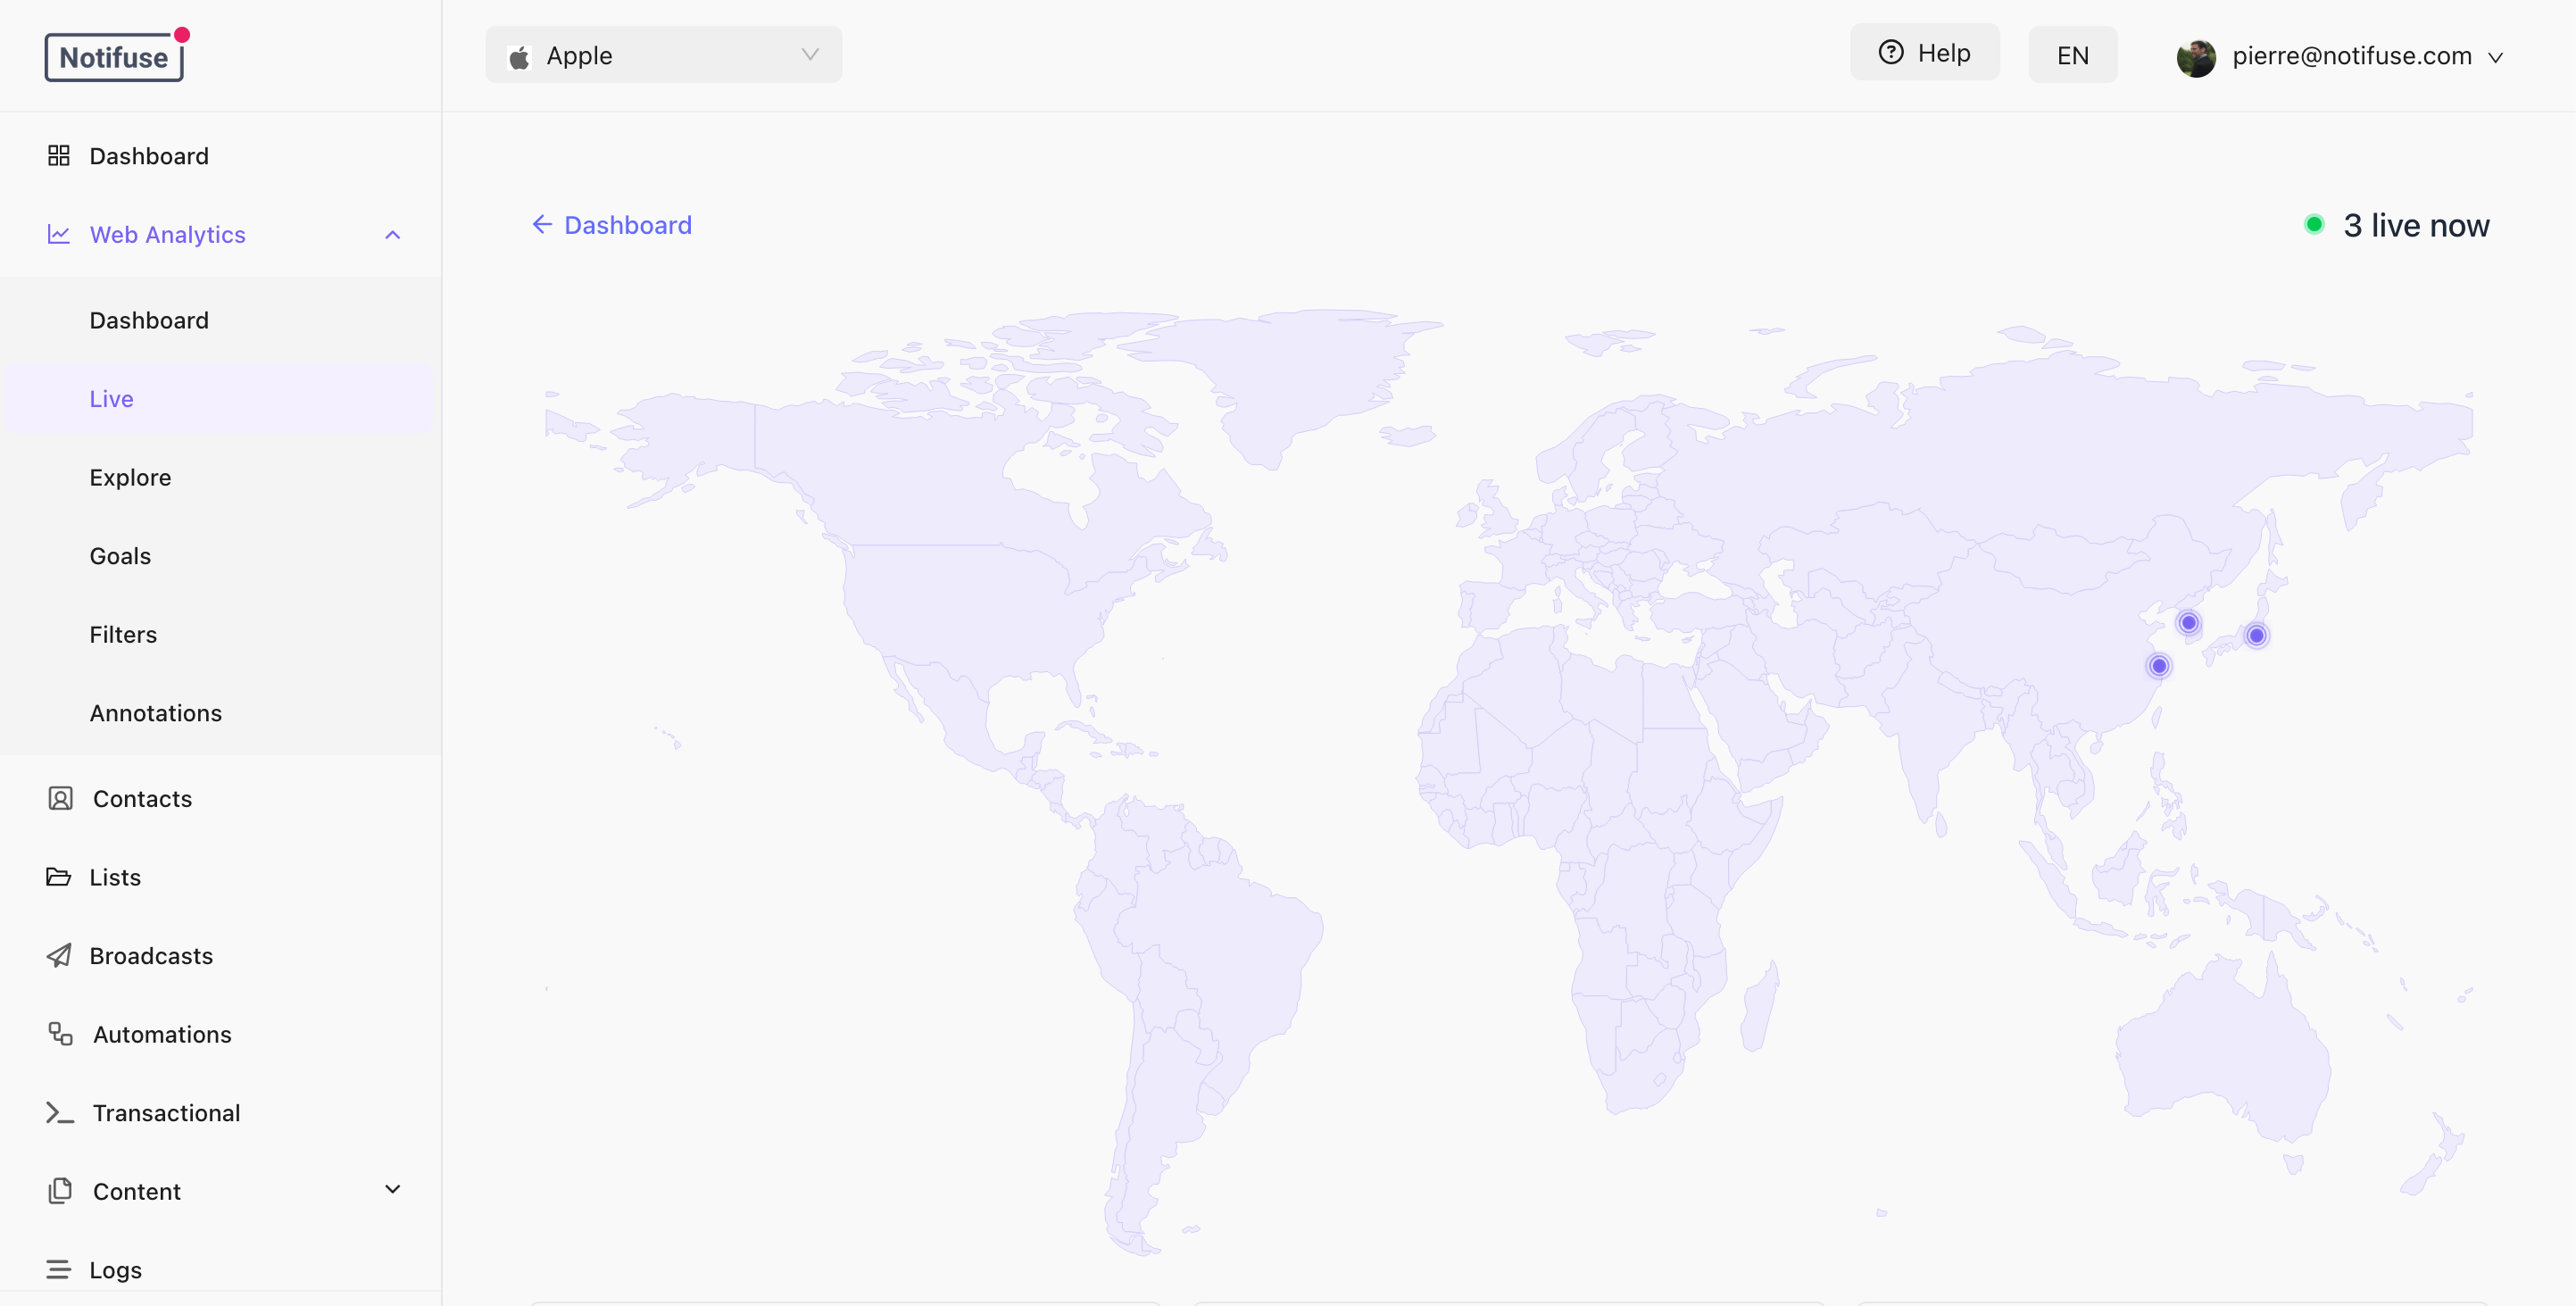
Live
Explore
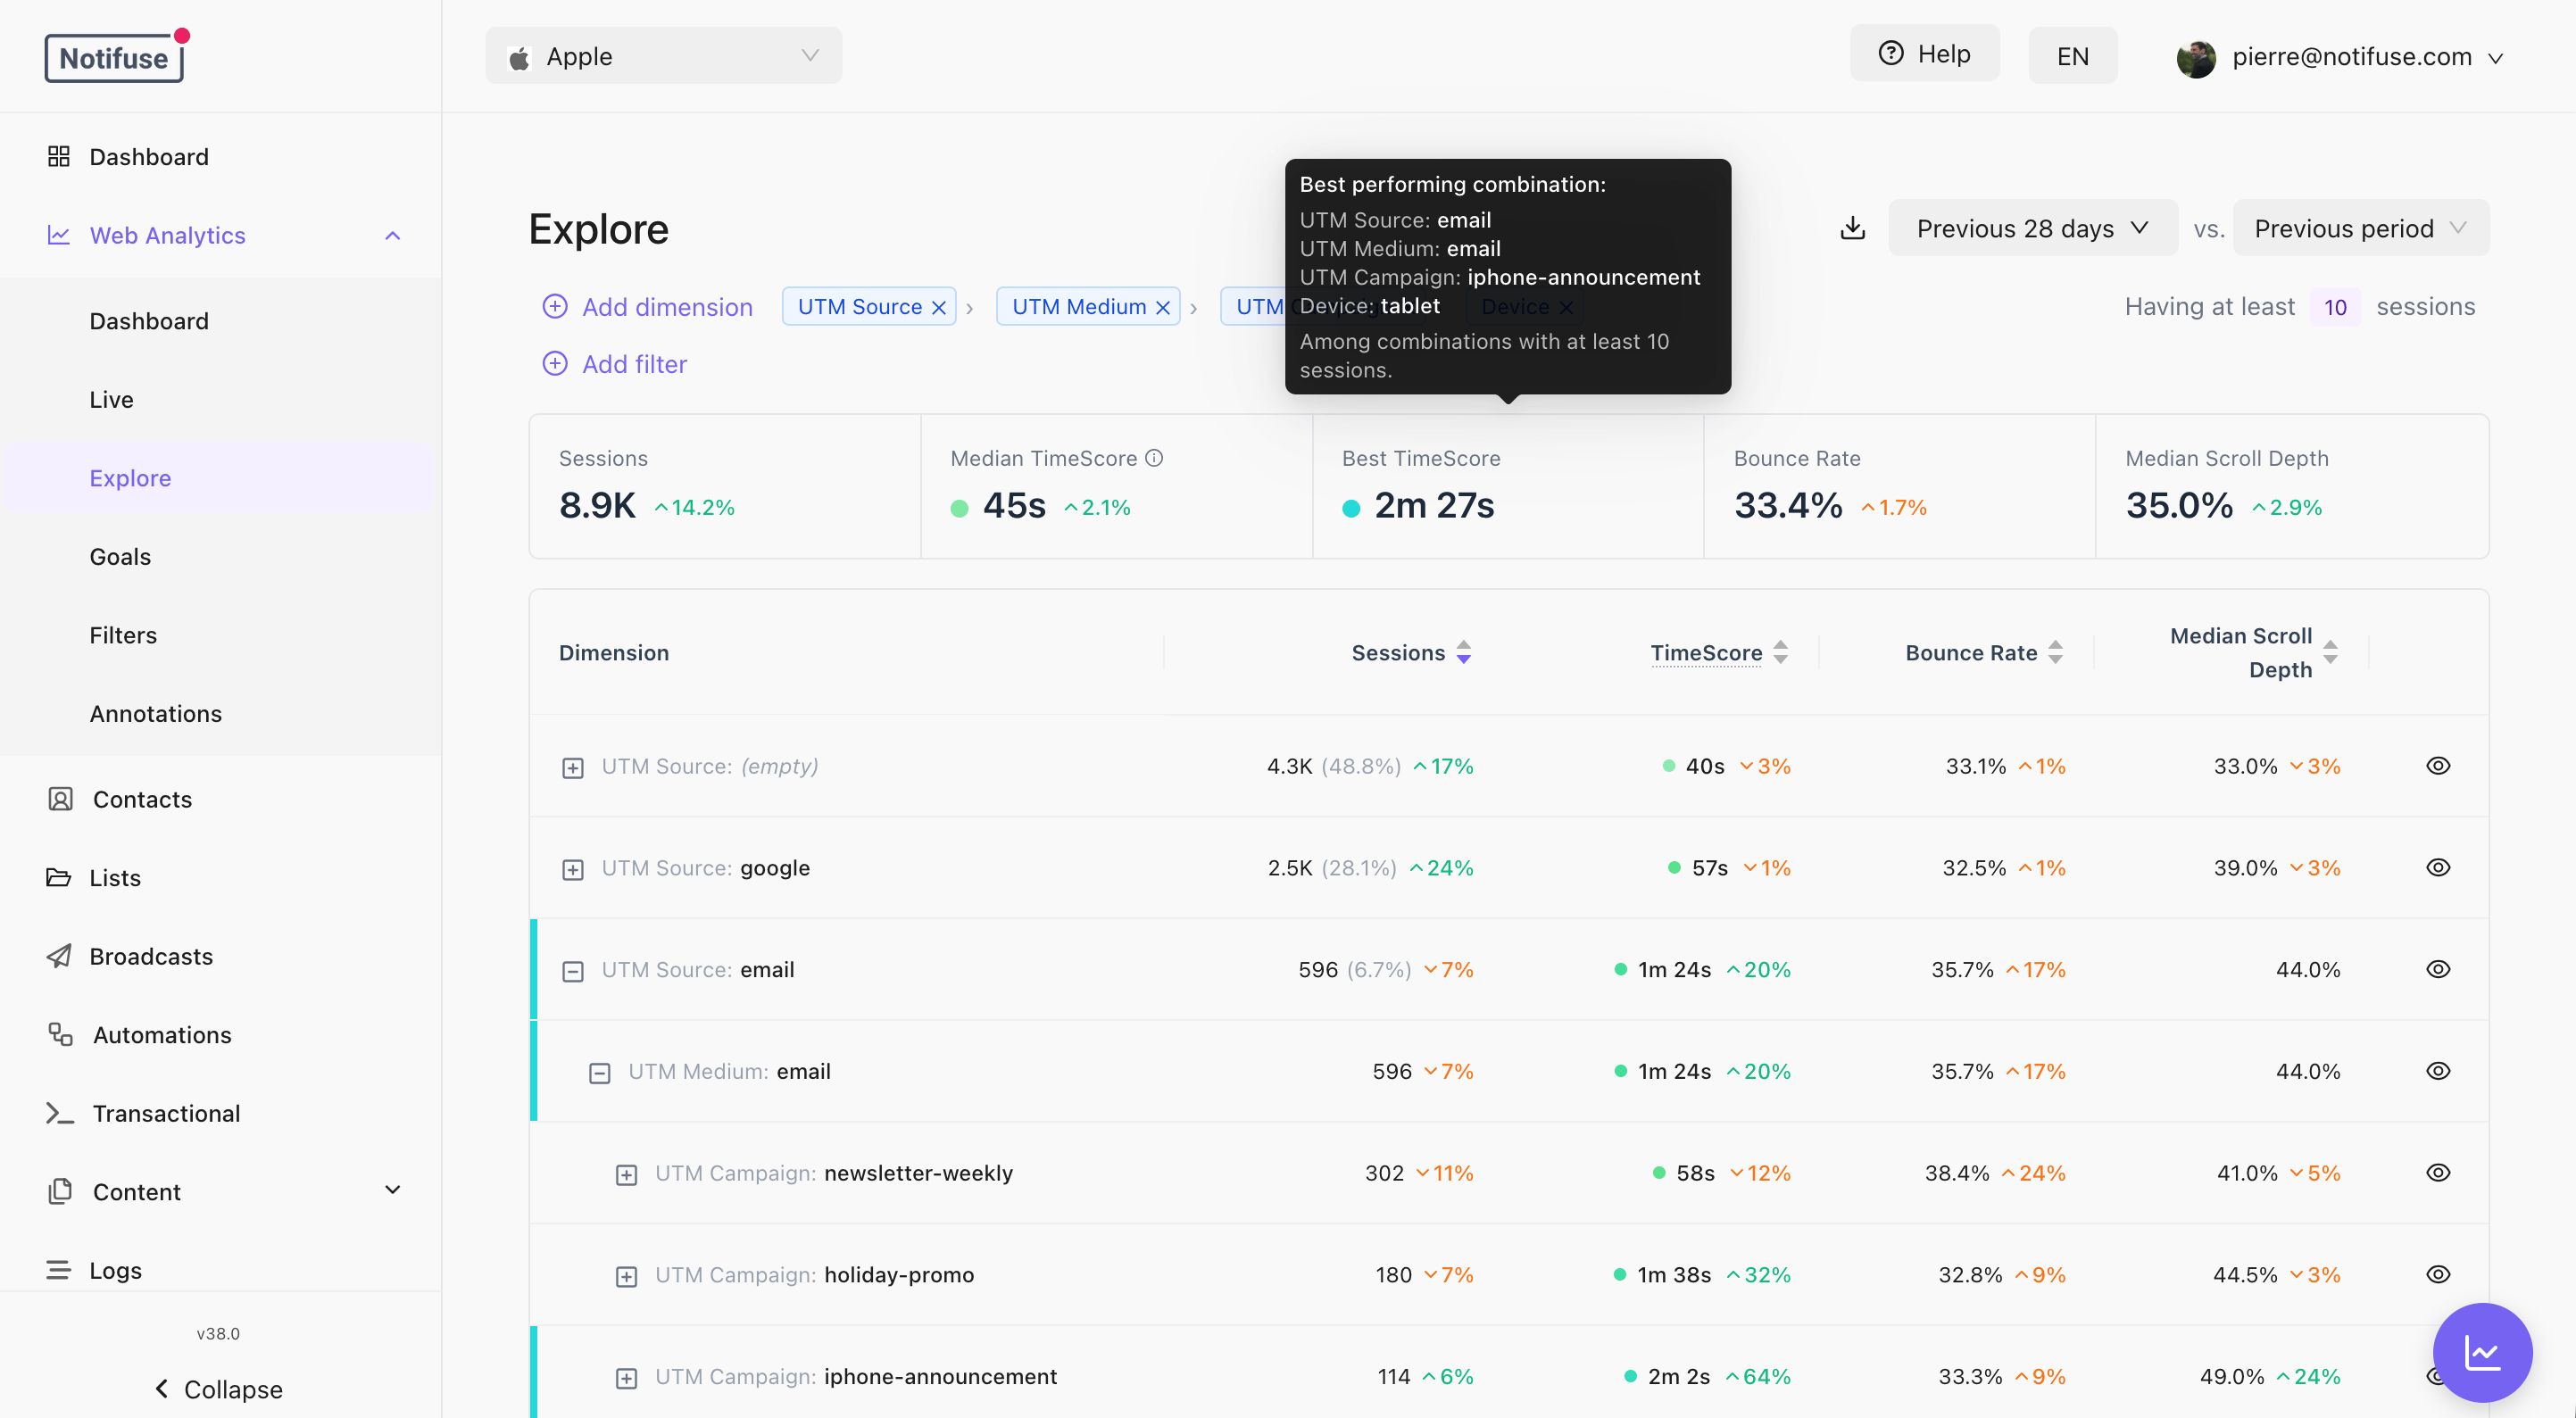
Dimensions are grouped as they appear in the picker:
- Channel: Channel, Channel Group
- UTM: Source, Medium, Campaign, Term, Content
- Traffic: Referrer, Referrer Domain, Referrer Path, Is Direct
- Pages: Landing Page, Landing Domain, Landing Path, Exit Path
- Device: Device, Browser, Browser Type, Operating System, Connection Type, screen and viewport size
- Geo: Country, Region, City, Language, Timezone
- Time: Hour of Day, Day of Week, Is Weekend, Year, Month, Day, Week Number
- Session: Pageview Count, Duration (ms), SDK Version
- User: Contact Email, once a visitor is identified
- Custom:
custom_1throughcustom_10, under whatever names you gave them
Time dimensions here are cyclic, and are extracted in the report’s timezone rather than UTC. “Traffic by hour of day” means the visitor’s morning, not a number that shifts when your server moves. The session’s own start and last-activity timestamps are what the date range filters on; they are not breakdowns.
Beyond the Screens
The three schemas define more than the screens display, and the analytics query API can reach all of it — the same endpoint the console calls, documented in the API Reference.- Sessions also define Pageviews, Pages / Session, Avg Scroll Depth, Median Page Duration, Sessions with Goals, Goal Value and Identified Contacts.
- Pageviews define Page Views, Unique Pages, Median Page Duration, Median Scroll Depth, Entries, Exits and Exit Rate, along with the page dimensions above. No Web Analytics screen queries them today.
- Goals define Goals, Total Goal Value, Avg Goal Value, Median Goal Value and Converting Sessions.
Median Page Duration means different things on the two schemas. On sessions it is the median across visits of each visit’s own median page time; the true per-page median is the identically named measure on the pageview schema.
Custom Dimensions
Ten slots let you record something only you know about a visit — a plan tier, a test variant, a logged-in role. Set them from your site by slot number:?custom_1=pro fills slot 1 whenever the tracker initialises on that page, which is useful for tagging traffic you send yourself without touching the page’s code.
The URL only fills slots that are still empty for the session. A value already set by
setDimension — or by an earlier URL in the same visit — wins. Values are read once at initialisation, so a client-side route change does not re-read them.custom_1 identity underneath, so renaming it never rewrites your data.
Custom dimensions can also be derived rather than sent — an attribution rule can write one from the referrer, a UTM value or a landing path, which is how you classify traffic you did not tag at the source.
Notes
- Values are capped at 256 bytes per custom dimension. The tracker’s own check counts characters, so non-ASCII values should stay well under 256 characters or the server will reject the beat.
- CSV exports respect the filters and period currently applied, up to 1,000 rows.
- API Reference