
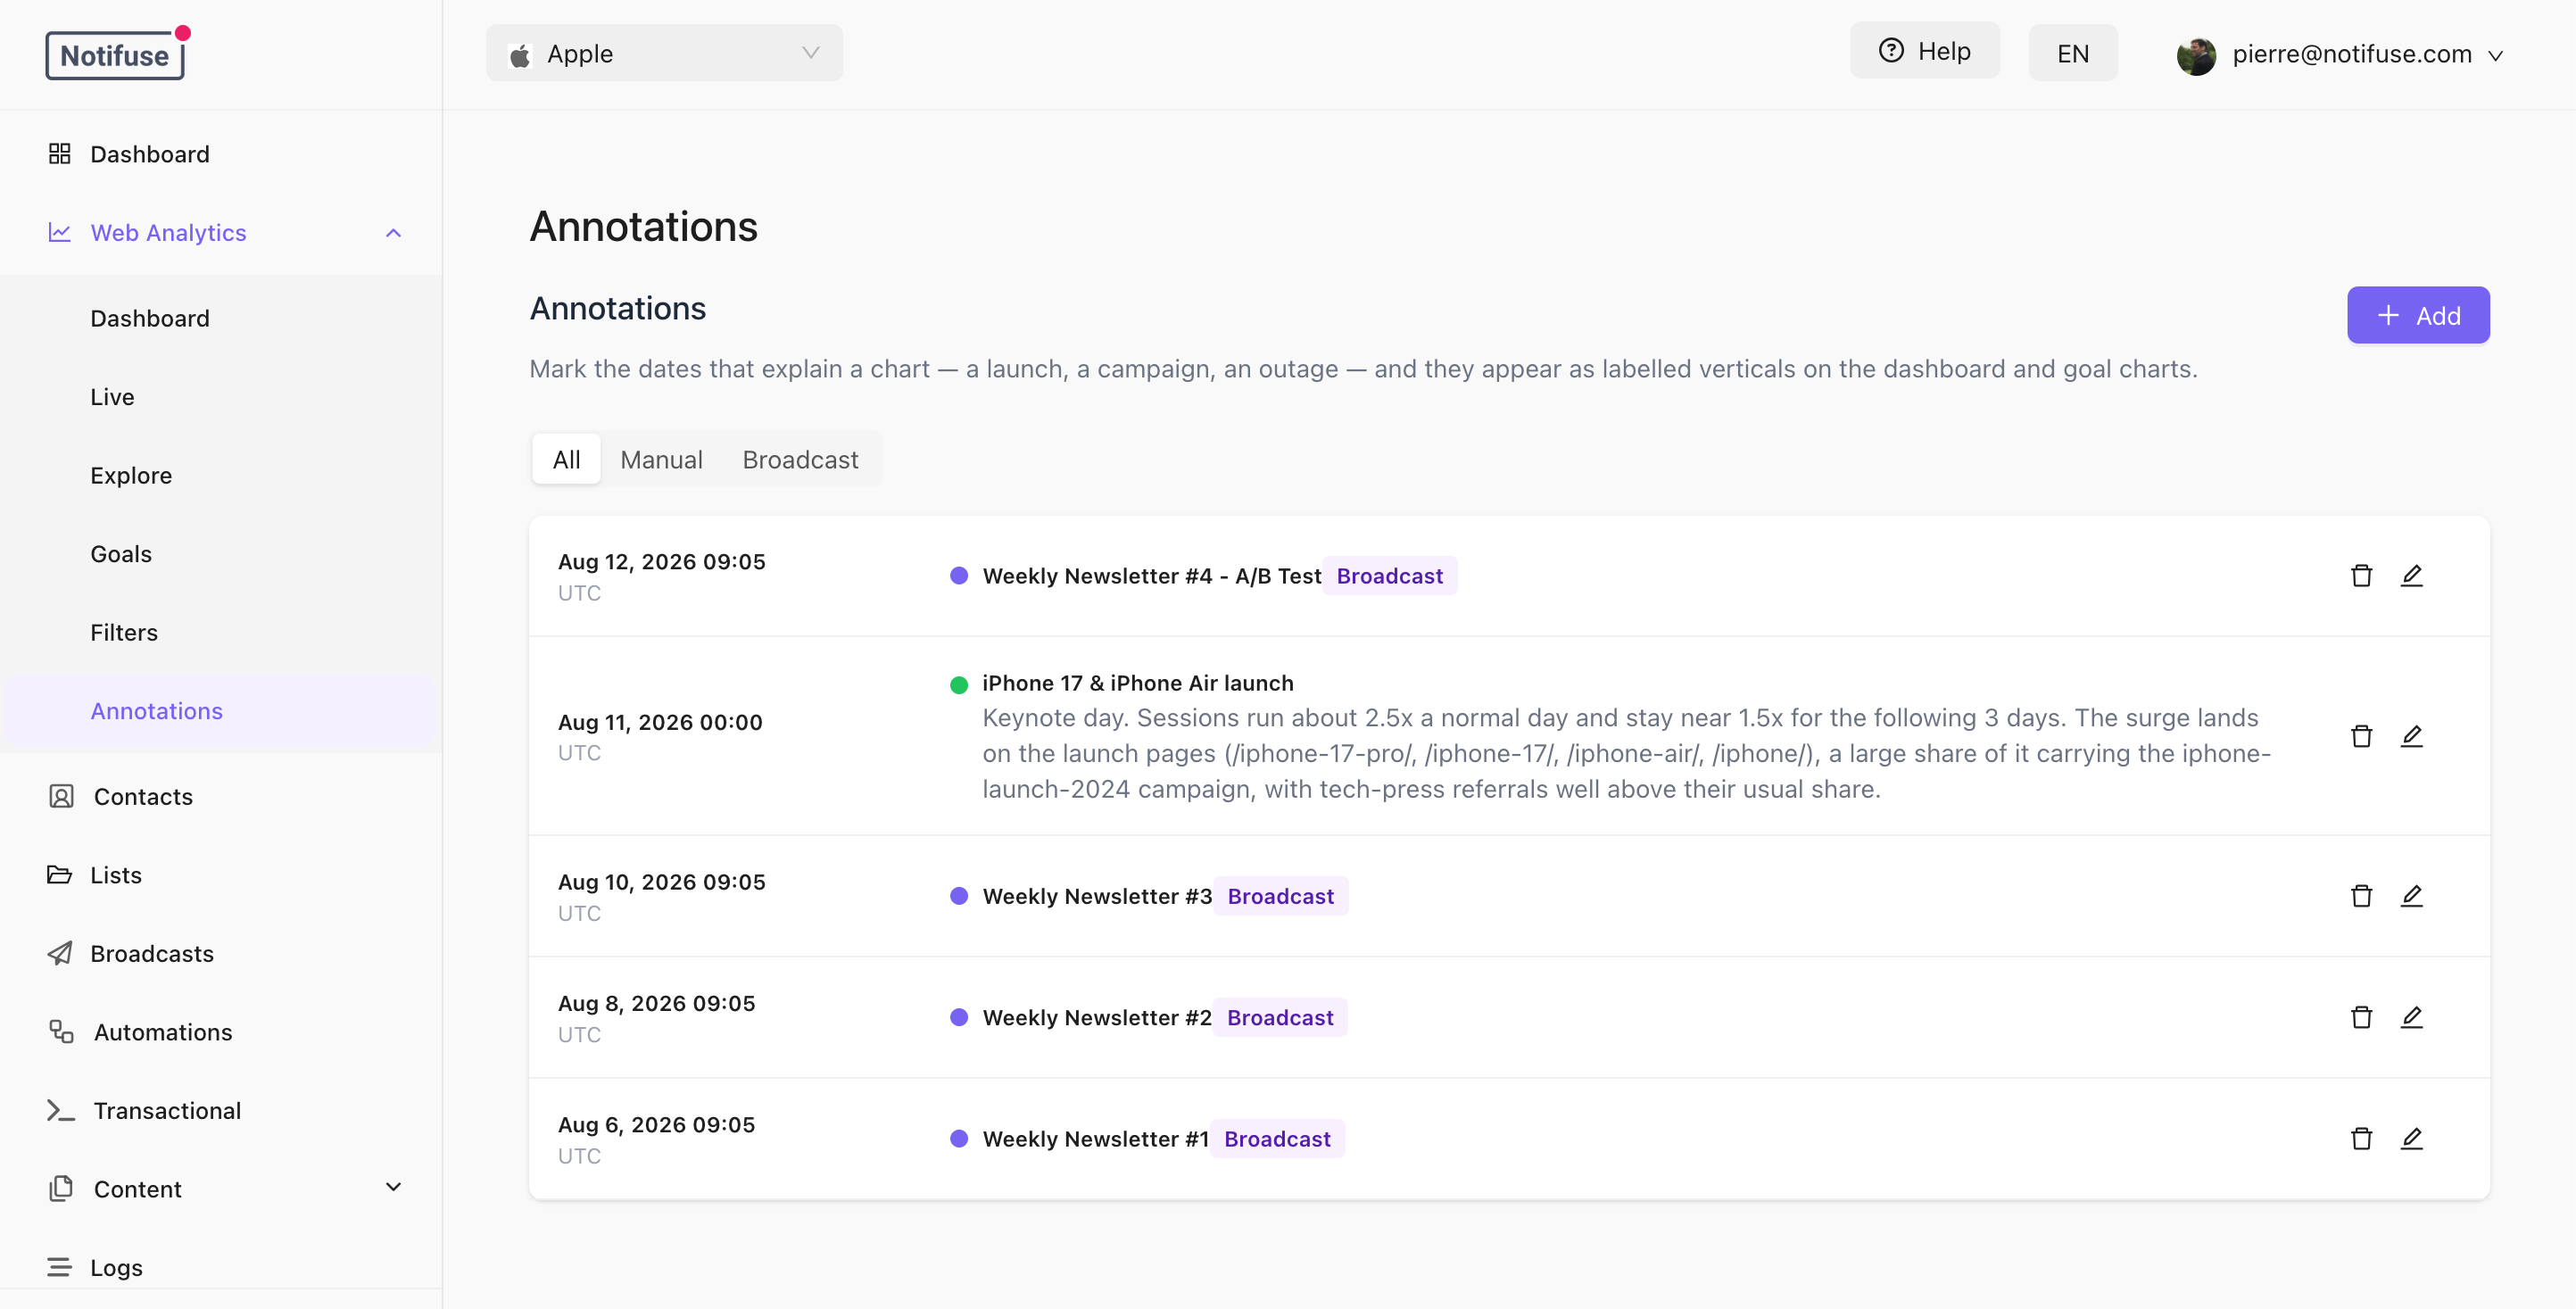
Adding an Annotation
Click Add and fill in the form:The timezone is stored with the annotation so the moment redisplays exactly as it was typed. An outage entered as 9am in Tokyo keeps reading as 9am for a colleague in Paris, instead of being rewritten into their own morning.
Where They Appear
On the Dashboard chart, and on the chart inside a goal’s drawer on the Goals section. Each annotation is drawn as a dotted vertical line in its own color, with its title printed at the top of the plot area — truncated there if it is long. Hovering that point on the chart adds the annotation’s title and description to the tooltip, under the metric values. The line lands on the bucket that contains the moment, so how precisely it sits depends on the granularity you are looking at. Annotations outside the period on screen are simply not drawn.Several annotations falling in the same bucket collapse to a single line, labelled with the first title and a
+N. Hover it and the tooltip lists all of them in full.Broadcast Annotations
Broadcasts annotate themselves. When a broadcast starts sending, an annotation carrying its name is written automatically, tagged Broadcast in the list and drawn in purple on the charts. That is what lets you see a traffic bump and the campaign that caused it on the same chart.- It is written only once the send genuinely begins — after the workspace, provider and template checks have all passed. A broadcast that fails to load its templates mails nobody and is never annotated.
- One annotation per broadcast, however many times its sending task resumes.
- They are always shown on the charts. There is deliberately no setting to hide them.
- The annotation is independent of the broadcast afterwards: deleting the broadcast leaves it standing, because the send did happen, and deleting the annotation does nothing to the broadcast.
Editing and Deleting
Every annotation can be edited or deleted from the list, broadcast ones included — you may well want to reword an automatic title into something you will recognise in six months. Editing changes the moment and its timezone, the text and the color only. A broadcast annotation keeps its origin and its tag however you rewrite it, and an annotation you typed yourself can never become a broadcast one. Deleting is immediate and cannot be undone.Managing Them Over the API
Annotations have five endpoints, documented in the API Reference:
Access follows the existing Web Analytics permission: read for
list and get, write for the rest.
This is the natural place to hook your deploy pipeline or your status page, so releases and incidents land on the chart without anyone typing them.
Notes
listreturns the 100 most recent annotations by default, and at most 1,000. The Annotations page and the charts both ask for the maximum.- The Annotations page works even before the tracker is installed, unlike the rest of Web Analytics — a workspace that only sends broadcasts still collects broadcast annotations.
- API Reference